Figure 5.
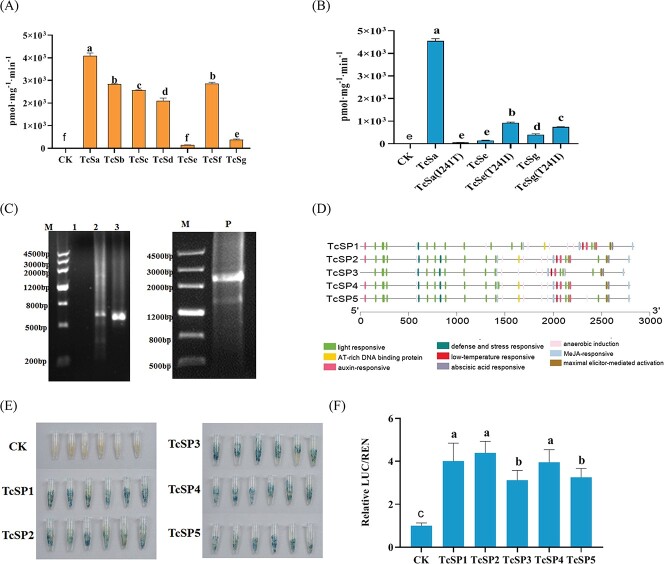
Comparison of the enzymatic and promoter activities of the TcS allelic variation. (A) Comparison of the enzymatic activity of TcSs (n = 3). CK: pMAL-c5x, P < 0.05; (B) Enzymatic activity of mutation protein (n = 3); (C) 536-bp sequence fragment obtained by genome walking and full-length fragment of TcS promoter with a length of 2686 bp on the right. 1–3: first-, second-, and third-round PCR product; P: TcS promoter. (D) Distribution of cis-acting element on the TcS promoter sequence of different variants. (E) GUS histochemical assay of different TcS promoters. (F) Dual-luciferase of different TcS promoter. Determination of the differences in promoter activity by detecting the ratio of firefly luciferase and renilla luciferase activities (n = 10). Different lowercase letters on the figure indicate significant difference at P < 0.05.

