Fig. 3.
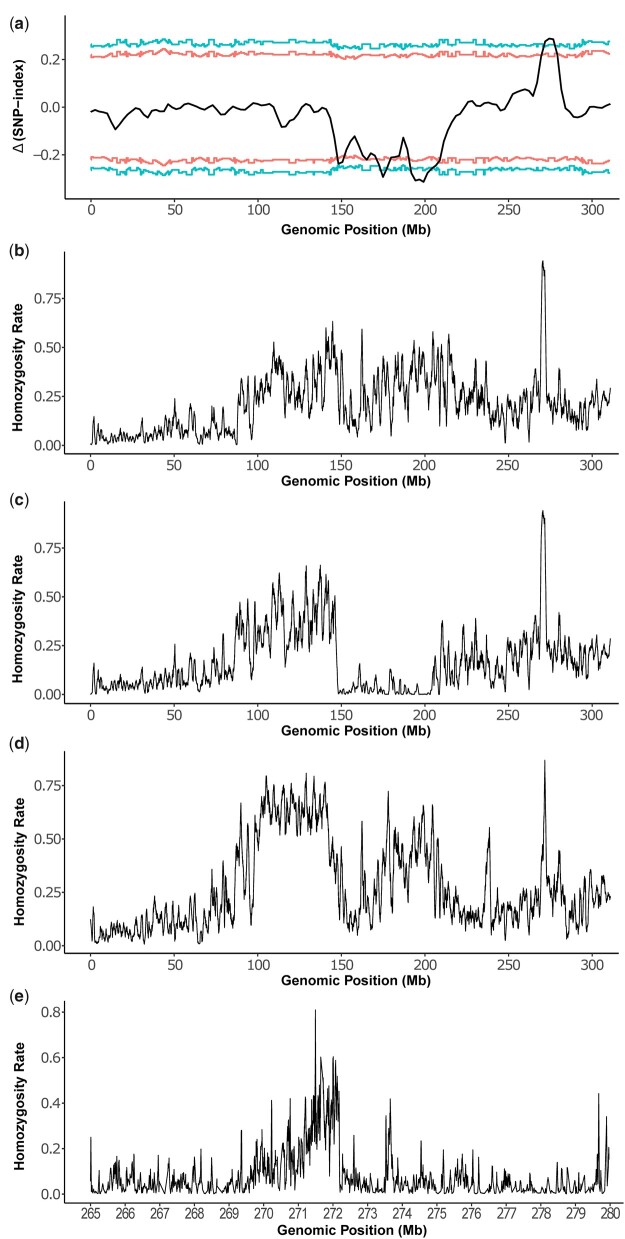
Mapping of re. a) MAM of re by plotting the Δ(SNP index) values in 1-Mb sliding windows. The corresponding 2-sided confidence intervals are shown as red (90%) or blue (95%) lines. X-axis is the genomic position on the homomorphic sex chromosome 1. The confidence intervals were estimated using 10,000 replicate simulations for all the SNP positions with the given read depths. The broad depression between 150 and 210 Mb likely reflects the sex-linked differences while the peak around 275 Mb is likely the location of re. Positions from 271,120,117 to 277,843,549 exceed 95% confidence and the left and right inflection points of this peak are 271,970,355 and 276,823,052, respectively. Homozygosity plots of red-eyed hybrids from F8THAF9MEX_F (b), F8THAF9MEX_M (c), and F7PAKF3BRA_F (d). X-axis is the genomic location on chromosome 1. Y-axis is the homozygosity of the alternative or nonreference alleles, which is calculated as (the number of unique alternative SNPs showing 100% frequency)/(the number of all unique alternative SNPs) in a 1-Mb window. We focused on unique alternative SNPs as we are only interested in SNPs showing 100% frequency. The peak for (b)–(d) is at 270–271, 270–271, and 271–272 Mb, respectively. e) Homozygosity analysis between 265 and 280 Mbp on chromosome 1 by pooling all 3 hybrid red-eyed samples. Y-axis is the homozygosity rate of the alternative or nonreference alleles, which is calculated as described above but in a 20-kb window. The highest level of homozygosity is at position 271,505,401.

