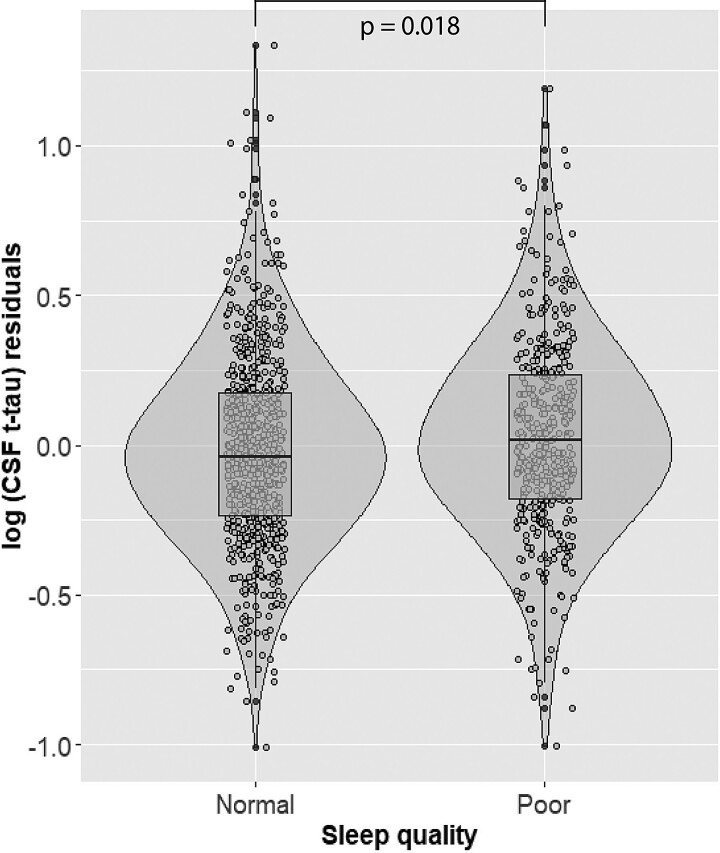
Figure 2.
Main effect of PSQI binary sleep category on CSF t-tau levels. On the X-axis are represented participants’ groups categorized as normal sleep group (PSQI ≤ 5) or poor sleep group (PSQI >5). On the Y-axis are represented the residuals of log-transformed t-tau levels, after regressing out the effect of age, sex, site of data collection, APOE-ɛ4 carriership, body mass index, physical activity and CSF Aβ42 levels. Presented P-values are derived from multivariate linear regression analyses.

