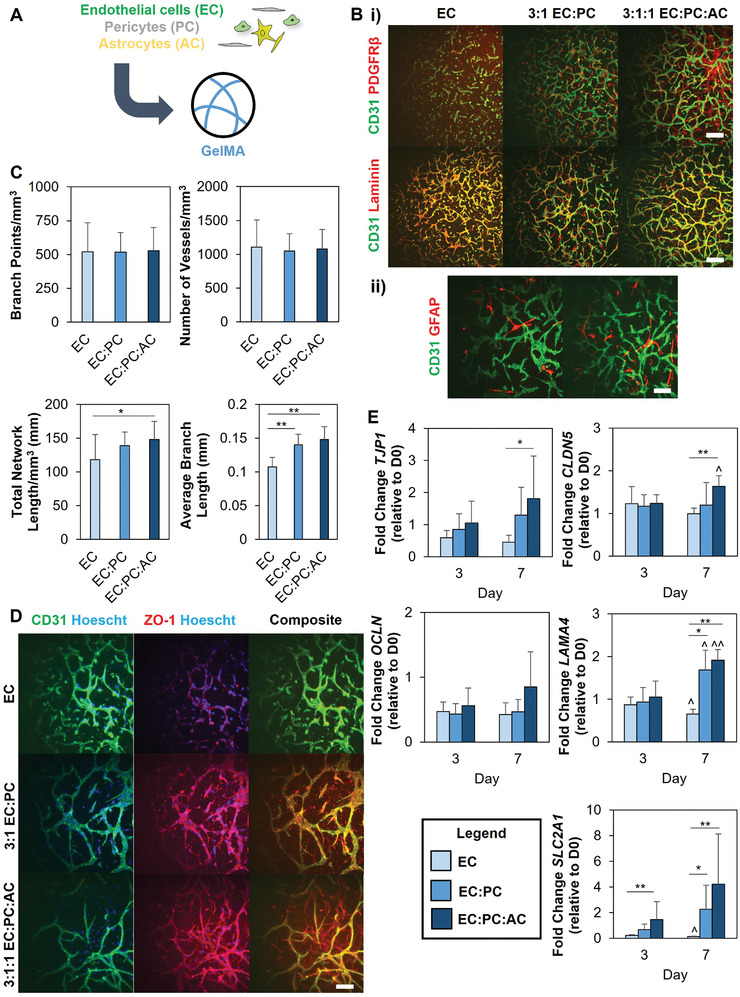
Figure 1.

A) Endothelial cells, either alone or combined with pericytes or pericytes and astrocytes, are encapsulated in GelMA hydrogels to self‐assemble into microvascular networks. B‐i) PDGFRβ expression and laminin deposition in microvascular networks. Scale bar = 200 µm ii) GFAP+ astrocytes interacting with microvascular networks in EC:PC:AC cultures. Images represent hydrogels after seven days of culture. Scale bar = 100 µm. C) Quantification of microvascular network architecture. Data analyzed using one‐way ANOVA with Tukey's post‐hoc or Kruskal‐Wallis test with Dunn's posthoc; *p < 0.05, **p < 0.001; N = 15 hydrogels. D) Immunofluorescent staining for ZO‐1 in microvascular cultures. Images represent hydrogels after seven days of culture. Scale bar = 100 µm. C) Gene expression trends for laminin (LAMA4), membrane transporter GLUT1 (SLC2A1), and tight junction proteins (TJP1, CLDN5, OCLN). Comparisons within the same time point performed using one‐way ANOVA with Tukey's post‐hoc or Kruskal‐Wallis test with Dunn's post‐hoc, and comparisons within the same experimental group performed using an unpaired t‐test; *p < 0.05, **p < 0.01 between groups; ^p < 0.05, ^^p < 0.01 compared to Day 3. N = 6 hydrogels per time point.
