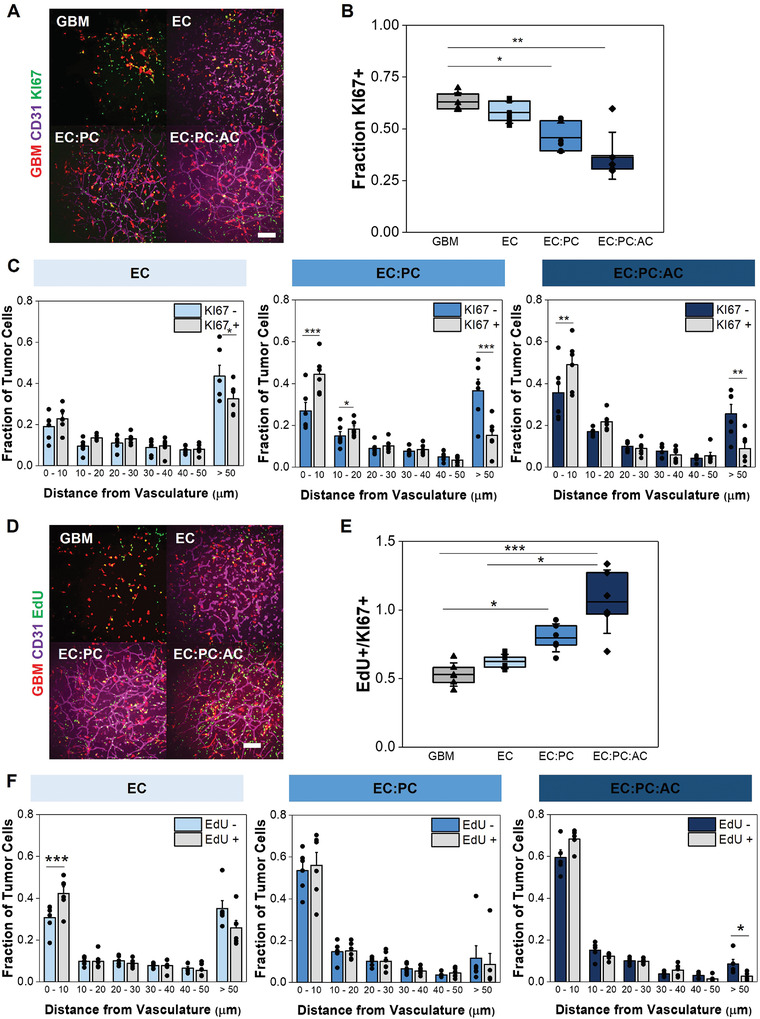
Figure 5.

A) Representative images of tumor‐vascular cocultures with KI67 staining. Scale bar = 200 µm. B) Quantification of the fraction of RFP‐expressing tumor cells that express KI67. Data analyzed using Kruskal‐Wallis test with Dunn's post‐hoc; *p < 0.05, **p < 0.01; N = 6 hydrogels. C) Comparing the proximity of KI67‐ versus KI67+ GBM6 cells to the microvascular network. Data points represent the fraction of tumor cells that are a specified distance from the microvascular network in a single hydrogel. Data analyzed using paired‐sample t‐tests; *p < 0.05, **p < 0.01, ***p < 0.001; N = 6 hydrogels. D) Representative images of tumor‐vascular cocultures with EdU staining. Scale bar = 200 µm. E) Quantification of the fraction of KI67+ tumor cells that incorporate EdU during a 24 h pulse. Data analyzed using Kruskal‐Wallis test with Dunn's post‐hoc; *p < 0.05, **p < 0.01; N = 6 hydrogels. F) Comparing the proximity of EdU‐ versus EdU+ GBM6 cells to the microvascular network. Data points represent the fraction of tumor cells that are a specified distance from the microvascular network in a single hydrogel. Data analyzed using paired‐sample t‐tests or Wilcoxon signed‐rank test;*p < 0.05, **p < 0.01, ***p < 0.001; N = 5–6 hydrogels.
