Figure 1.

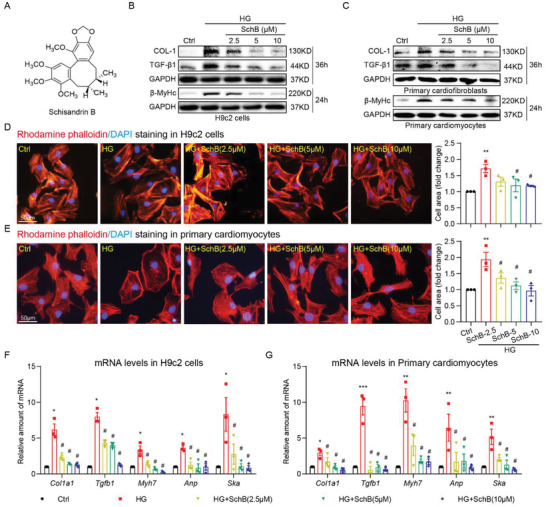
Sch B reduces HG‐induced cardiomyocyte hypertrophy and fibrotic responses. A) The chemical structure of Schisandrin B. B) Immunoblot analysis for β‐MyHc, Col‐1, and TGF‐β1 in H9C2 cells exposed to 33 × 10−3 m glucose (HG). Cells were pretreated with Sch B at indicated concentrations for 1 h and then stimulated with HG for 24 or 36 h. GAPDH was used as loading control. C) Immunoblot analysis for fibrosis markers in primary cardiac fibroblasts and hypertrophy marker in primary cardiomyocytes. Cells were pretreated with Sch B for 1 h before exposure to HG for 24 or 36 h. GAPHD was used as control. D,E) Rhodamine phalloidin staining of D) H9C2 and E) primary cardiomyocytes, showing the effect of Sch B on HG‐induced hypertrophy. Cells were treated as indicated for panel (B). Cells were counterstained with DAPI. Right panel shows the quantification of cell size, respectively [scale bar = 50 µm]. F,G) qPCR analysis of hypertrophic/fibrotic response genes in F) H9C2 cells and G) primary cardiomyocytes. Cells were pretreated with Sch B for 1 h and then stimulated with HG for 12 h. Levels of Col1a1, Tgfb1, Myh6, Anp, and Ska were normalized to Actb. Data in panels (D)–(G) shown as mean ± SEM (n = 3; *p < 0.05, **p < 0.01, ***p < 0.001, compared to Ctrl and #p < 0.05 compared to HG by one‐way ANOVA followed by Bonferroni's multiple comparisons test).
