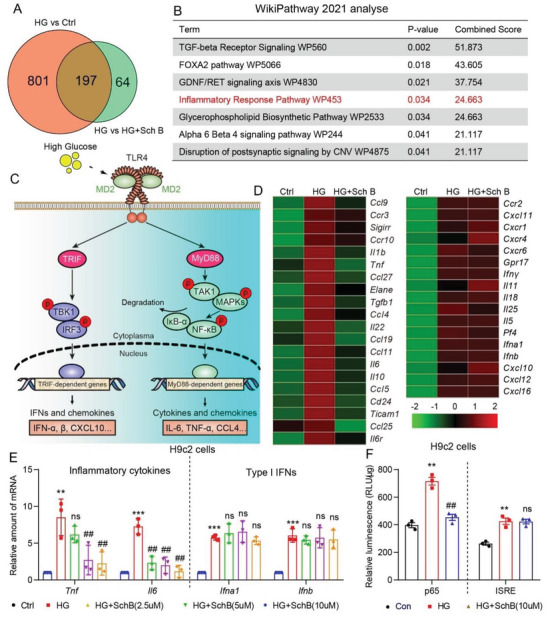
Figure 2.

Sch B regulates the expression of inflammatory cytokines in H9C2 cells. A,B) H9C2 cells were pretreated with 10 × 10−6 m Sch B for 1 h before exposure to HG for 6 h. RNA sequencing was carried out and differentially expressed genes were identified by DESeq 2. Panel (A) shows the Venn diagram of differentially expressed genes between control versus HG and HG versus HG+Sch B. WikiPathway enrich analysis of overlap of differentially expressed genes in plane B. The inflammatory response pathway is highlighted by red. C) Schematic illustrating HG‐induced innate toll‐like receptor‐4 (TLR4) signaling leading to the induction of inflammatory factors. D) Heat‐map of inflammation cytokines detected by qPCR assay. H9C2 cells were pretreated with 10 × 10−6 m Sch B for 1 h and then exposed to HG for 8 h. Left panel shows inflammation cytokines that were suppressed by Sch B pretreatment. Right panel shows factors that were not suppressed by Sch B. E) qPCR verification of classical TLR4 proinflammatory cytokines (TNF‐α and IL6) and type 1 interferons (IFN‐α and ‐β) in H9C2 cells pretreated with Sch B before HG exposure. Cells were treated as indicated for panel (D). F) NF‐κB and IRES reporter activity in H9C2 cells exposed to HG, with or without Sch B pretreatment. Data in panels (E) and (F) are shown as mean ± SEM (n = 3; **p < 0.01, ***p < 0.001 compared to Ctrl and ##p < 0.01, ns = not significant, compared to by one‐way ANOVA followed by Bonferroni's multiple comparisons test).
