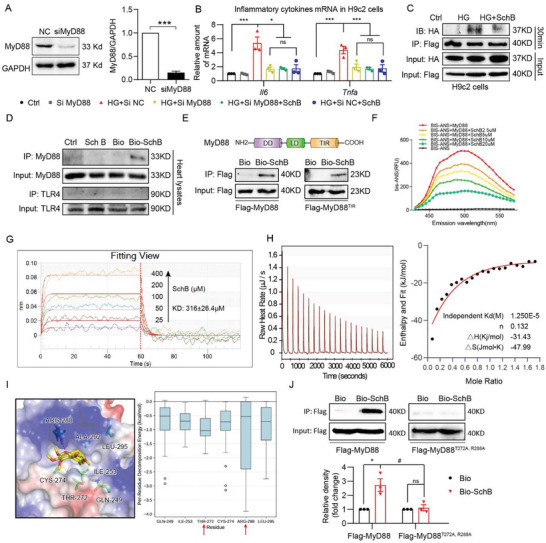
Figure 4.

Sch B directly binds to MyD88. A) Western blot analysis of MyD88 knockdown in H9C2 cells. Cells were transfected with negative control siRNA (NC) or siRNA against MyD88 (siMyD88). GAPDH was used as loading control. (Values represent the mean ± SEM; n = 3; ***p < 0.001 compared to NC by unpaired two‐tailed Student's t‐test). B) qPCR analysis of inflammatory cytokines in H9C2 cells transfected with MyD88 siRNA. Transfected cells were treated with 10 × 10−6 m Sch B for 1 h before exposure to HG for 8 h. Untransfected (Ctrl) and cells transfected with negative control siRNA (NC) were used as control (values represent mean ± SEM; n = 3; ns = not significant; *p < 0.05; ***p < 0.001 compared to control, and #p < 0.05 compared to HG+siNC by unpaired two‐tailed Student's t‐test). C) H9C2 cells were transfected with Flag‐ and HA‐tagged MyD88. Cells were treated with 10 × 10−6 m Sch B for 1 h and then exposed to HG for 30 min. Flag was immunoprecipitated and HA was detected to examine MyD88 dimerization. D) Binding of biotinylated‐Sch B to MyD88 was determined by immunoblotting. Bio‐Sch B was added to streptavidin‐agarose beads. Untreated beads, unconjugated Sch B, and biotin alone were used as control. Lysates prepared from control mouse heart tissues were added. E) Western blot analysis of the binding of Bio‐Sch B to MyD88‐TIR domain. Lysates prepared from HEK 293T cells transfected with Flag‐tagged full MyD88 or Flag‐tagged MyD88 TIR domain only were incubated with Bio‐Sch B‐loaded beads or biotin‐loaded beads. Upper panel shows the structure of MyD88 and lower panel shows pulled proteins. F) Fluorescence spectroscopy utilizing bis‐ANS showing the binding of Sch B to rhMyD88. G) SPR analysis showing interaction between Sch B and recombinant MyD88 protein. Sch B was added at different concentrations and KD values were calculated (shown in the insert). H) ITC analysis for MyD88 binding to Sch B. Representative image shown. The left panel shows the representative titration thermograms, and the right panel shows the data integration with fitted curves (independent model) of Sch B with MyD88(TIR). I) The binding pocket of Sch B and the key residues with the lowest binding energy. Left panel shows the carbon atoms of six key residues’ side chain and Sch B represented as green sticks and yellow sticks, respectively. Right panel shows the boxplot of the per‐residue decomposition energy of the six residues. Red arrows indicate potentially important residues. J) Pull‐down analysis of the binding of Bio‐Sch B to mutant MyD88 containing T272A and R288A. HEK 393T cells were transfected with wildtype MyD88 or mutant variants. Lysates were used to detect binding to bio‐Sch B (mean ± SEM; n = 3; ns = not significant; *p < 0.05 compared to Bio; #p < 0.05 compared to Bio‐Sch B by unpaired two‐tailed Student's t‐test).
