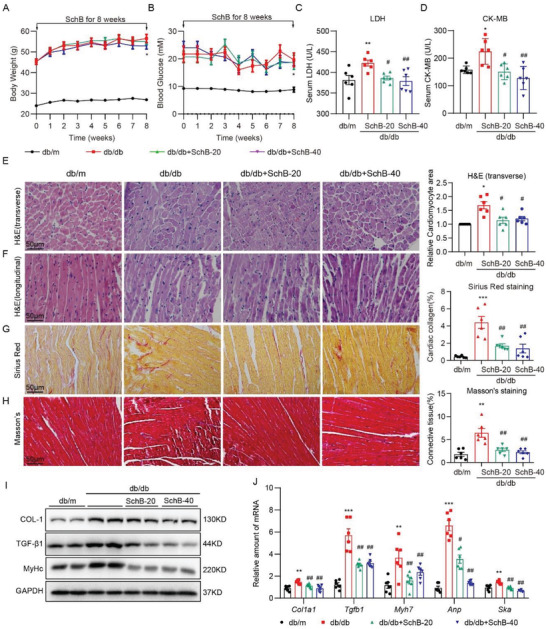
Figure 5.

Sch B suppresses cardiac hypertrophy and fibrosis in db/db mice. A) Body weight of mice at time points indicated. B) Blood glucose levels in mice. C,D) Levels of serum C) LDH and D) CK‐MB in mice. E,F) Representative H&E‐stained images of mouse heart tissues showing E) transverse and F) longitudinal sections. Right panel showing quantification of cardiomyocyte size determined from transverse sections (scale bar = 50 µm). G) Representative images of Sirius Red staining of heart tissues. Quantification of collagen levels is shown on right (scale bar = 50 µm). H) Representative images of Masson's trichrome staining of heart tissues. Quantification of fibrosis is shown on right (scale bar = 50 µm). I) Immunoblotting of Col‐1, TGF‐β1, β‐MyHc in heart tissue. GAPDH was used as loading control. J) qPCR analysis of cardiac fibrosis and hypertrophy genes in heart tissues. mRNA levels were normalized to Actb. Data in all panels are shown as mean ± SEM (n = 6 per group; *p < 0.05, **p < 0.01, ***p < 0.001 compared to db/m and #p < 0.05, ##p < 0.01 compared to db/db by one‐way ANOVA followed by Bonferroni's multiple comparisons test).
