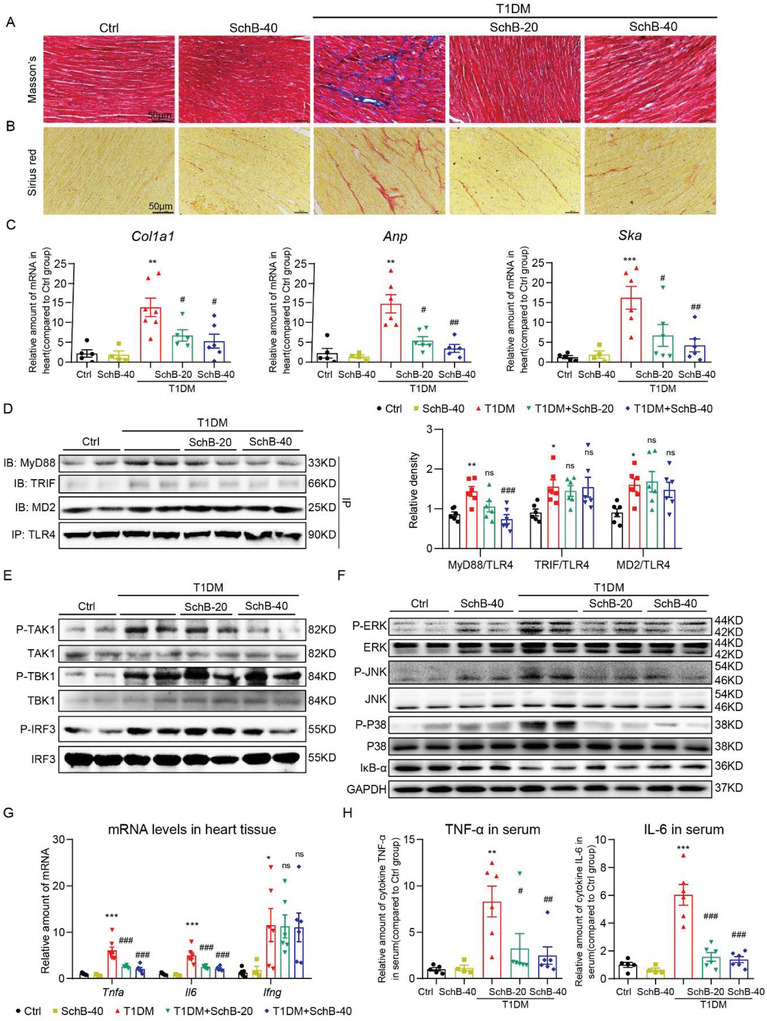
Figure 7.

Sch B treatment suppresses cardiac injury in STZ‐induced model of type 1 diabetes. A,B) Representative images of A) Masson's trichrome and B) Sirius red staining of heart tissues (scale bar = 50 µm). C) mRNA levels of Cola1, Anp, and Ska in heart tissues. Transcripts were normalized to Actb. D) TLR4 was immunoprecipitated (IP) from mouse heart lysates and MD2, TRIF, and MyD88 were detected by immunoblotting (IB). Right panel shows the densitometric quantification. E) Western blot analysis of pathway activation downstream of MyD88 in heart tissues. Phosphorylated TAK1, TBK1, and IRF3 were detected. Total proteins were used as control. F) Analysis of MAPK and NF‐κB activation in heart tissues of STZ‐induced T1DM mice. Phosphorylated ERK, JNK, and p38 were detected. Total proteins were used as control. IκB‐α was used to measure NF‐κB activity, with GAPDH as the loading control. G) mRNA levels of Tnfa, Il6, and Ifng in heart tissues of mice. Transcripts were normalized to Actb. H) Protein levels of IL‐6 and TNF‐α in serum of mice were examined by ELISA. Data in panels (C), (D), (G), and (H) are shown as mean ± SEM (n = 6 per group; *p < 0.05, **p < 0.01, ***p < 0.001 compared to Ctrl; ns = not significant, #p < 0.05, ##p < 0.01, ###p < 0.001 compared to T1DM by one‐way ANOVA followed by Bonferroni's multiple comparisons test).
