Figure 2.

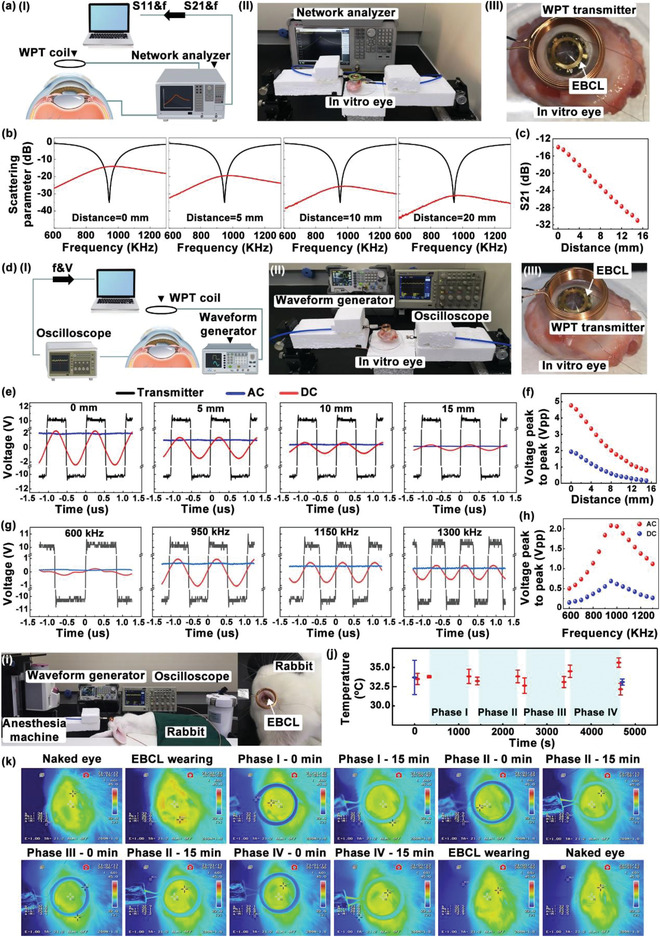
Characterization of the WPT and rectification circuit. a‐I) Schematic diagram and a‐II) optical image of the scattering parameters measurement of the WPT system. a‐III) Photograph of the WPT system. The contact lens integrated with the WPT receiver was worn on in vitro porcine eye. b) Scattering parameters’ measurement of the WPT system. Return loss (S11) recorded from the WPT transmitter was plotted as black curves. Insert loss (S21) recorded from the WPT receiver was plotted as red curves. c) The influence of radiation distance and frequency on wireless voltage transfer. d‐I) Schematic diagram and d‐II) photograph of the scattering parameters’ measurement of the WPT system. d‐III) The contact lens integrated with the WPT receiver and aligned over transmitter along the identical axis was worn on in vitro porcine eye. e) Voltage waveform collected on the coils (red curves) and electrical stimulation electrodes (blue curves) of the WPT receive circuit under different radiation distances with 20 Vpp square voltage applied on the transmitter (black curves). f) Peak‐to‐peak voltage before and after rectification was plotted as a function of distance. g) Voltage waveform collected on the coils and electrical stimulation electrodes of the WPT receive circuit under different radiation frequencies with 20 Vpp square voltage applied on the transmitter. h) Peak‐to‐peak voltage before and after rectification was plotted as a function of frequency. Thermal characterization during animal experimentation. i) Left: photograph of wireless‐powered electrical stimulation during animal experimentation. Right: Wireless‐powered bandage contact lens worn on cornea of the anesthetic rabbit. j) Statistical temperature of the bandage contact lens and cornea during animal experimentation. k) Infrared images of rabbit eye and bandage contact lens during animal experimentation.
