
Figure 4.
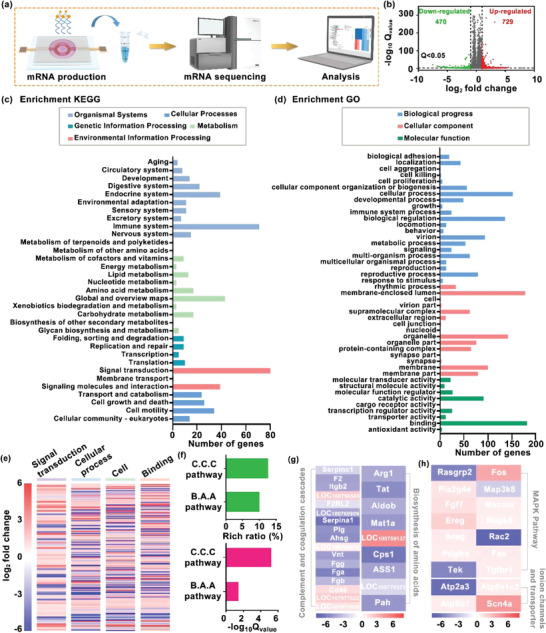
Study of mechanism of epithelial wound healing treated by electrical stimulation. a) Schematic diagram of the mRNA sequencing procedure. The experimental group was given electrical stimulation treatment, while the control group was not given any interventions and then transported to the company at a low temperature for mRNA detection. b) Volcano plots displayed 729 significantly upregulated genes and 470 significantly downregulated genes whose Q value is <0.05 and |log 2| fold change ≥ 1 compared the electrical stimulation group with the control group. c,d) The number of differentially expressed genes (DEGs) analyzed by KEGG and GO. The KEGG analysis showed that the changes in DEGs were mainly involved in the 33 classifications related to biochemical metabolic and signal transductions, and there were 45 gene classifications that changed linked to the cellular process by GO analysis. e) Major changes of gene expression induced by electrical stimulation. f) Rich ratio (%) and Q value of genes in the enriched KEGG which are highly related to complement and coagulation cascades (C.C.C.) and biosynthesis of amino acids (B.A.A.) pathways. g,h) Heat maps of the genes encoding complement and coagulation cascades, biosynthesis of amino acids, MAPK pathways, ion channels, and transporter.