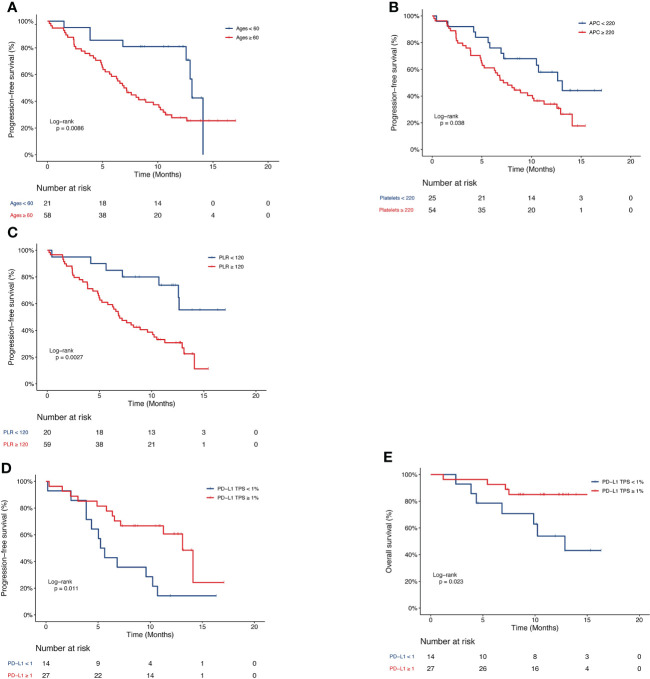
Figure 2.
Kaplan-Meier curve of PFS or OS of patients in the pembrolizumab group. PFS of patients stratified by (A) age, (B) APC, (C) PLR and (D) PD-L1 TPS. (E) OS of patients stratified by PD-L1 TPS. PFS, progression-free survival; OS, overall survival; APC, absolute platelet count; PLR, platelet-to-lymphocyte ratio; PD-L1 TPS, programmed death-1 tumor proportion score.

