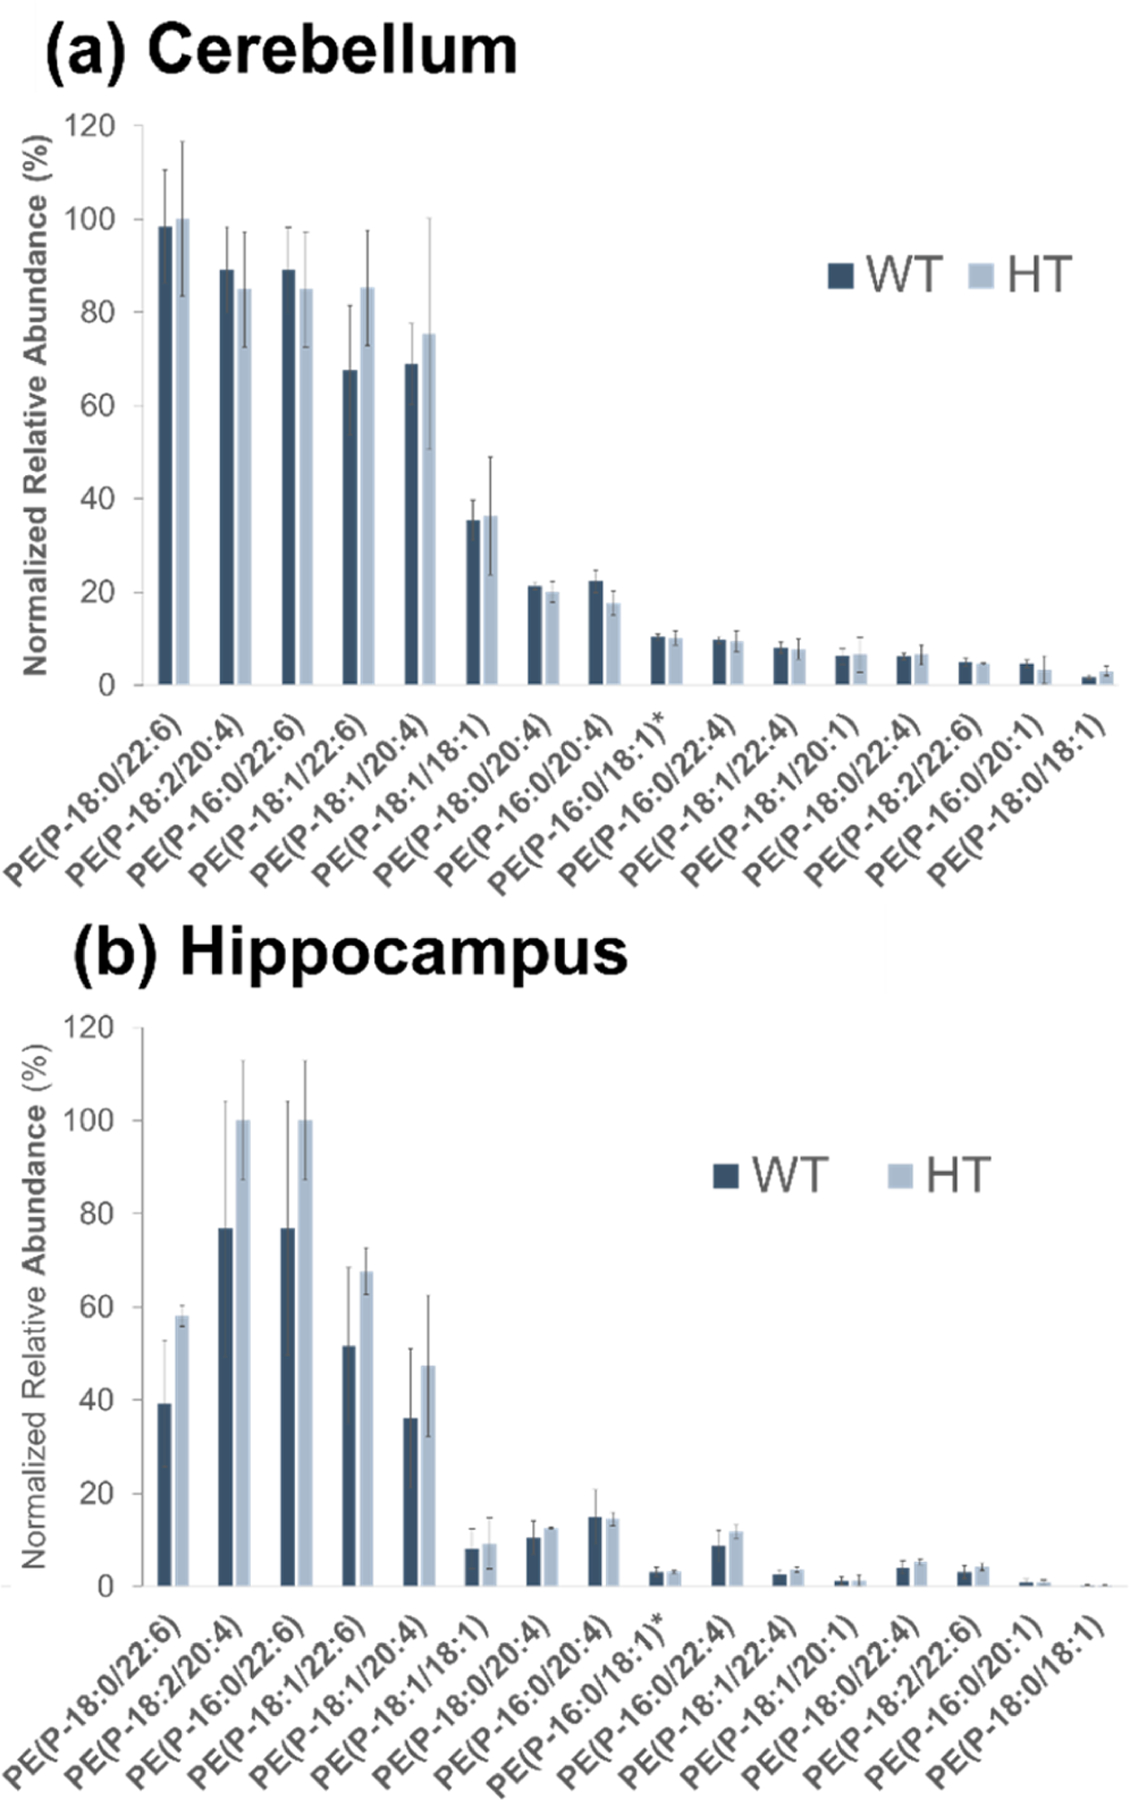
Figure 2.

Bar graphs of normalized peak areas of identified ether lipids for (a) cerebellum and (b) hippocampus mouse tissue. Samples are grouped by genotype (WT, HT). No statistically significant differences are observed for WT and HT ether lipid abundances. PE(P-16:0/18:1) and PE(P-18:1/16:0) are isomeric and not distinguishable. The entry on the x-axis is designated as PE(P-16:0/18:1)*.
