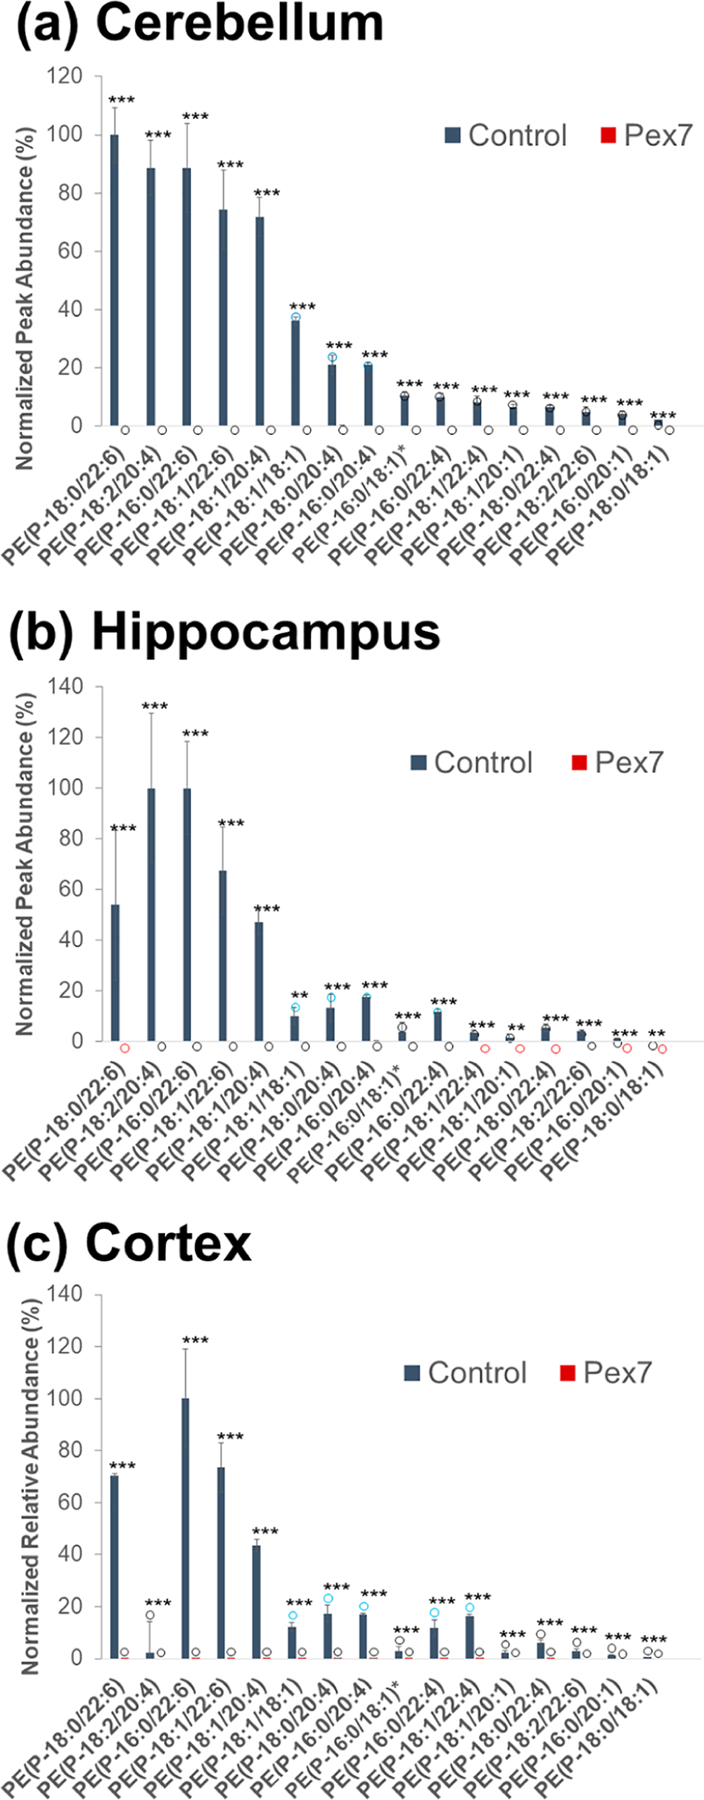
Figure 3.

Bar graphs of normalized peak areas of identified ether lipids for (a) cerebellum, (b) hippocampus, and (c) cortex mouse tissue. Samples are grouped by control (genotype WT, HT) and disease (genotype HO, i.e. Pex7 mutation). Statistical significance levels are marked as p < 0.01 (***) and p < 0.05 (**). Blue, black and red circles indicate normalized abundances that are below LOQ, below LOD, and not detected, respectively. PE(P-16:0/18:1) and PE(P-18:1/16:0) are isomeric and not distinguishable. The entry on the x-axis is designated as PE(P-16:0/18:1)*.
