

Abstract
Pterostilbene, a stilbene phytoalexin, is mainly obtained from blueberries and grape vines; however, its metabolic mechanisms were unclear in vivo. In the present study, three different methods were used to prepare biological samples, and then, an efficient strategy based on ultrahigh-performance liquid chromatography coupled with mass spectrometry was developed to screen and identify pterostilbene metabolites in rat urine, plasma, liver, and feces. In order to elucidate pterostilbene or its metabolites involved in vitro, this study was assessed by the liver microsome system. As a result, a total of 88 pterostilbene metabolites were characterized. Among them, 77 metabolites in vivo and 14 metabolites in vitro were found; 50 and 38 metabolites were observed in rat plasma and urine, while only 4 and 12 metabolites were detected in rat feces and liver, inferring that plasma and urine possessed more diverse types of pterostilbene metabolites; 41 metabolic products were obtained by solid-phase extraction, and 9 and 10 metabolites were screened by methanol precipitation and acetonitrile precipitation, respectively, indicating that solid-phase extraction could be adopted as the most acceptable method for pterostilbene metabolism. The results also demonstrated that pterostilbene mainly underwent glucosylation, dehydrogenation, hydrogenation, demethoxylation, sulfation, NAC binding, methylene ketogenic, acetylation, and methylation. In summary, this research provides an idea for the further study of drug metabolism.
1. Introduction
Pterostilbene (3,5-dimethoxy-4′-hydroxystilbene) is a dimethylated analogue of resveratrol possessing greater bioavailability due to the presence of two methoxyl groups1 and has been widely found in blueberries, grape vines, and a series of other berries.2 Multiple studies have demonstrated the beneficial effects of pterostilbene on antioxidant activity, anti-inflammatory,3 anticancer,4 and antiobesity.5 Additionally, pterostilbene administration could reduce body fat accumulation through the enhancement of energy metabolism.6 One study revealed that it could alleviate the progression of liver injury by changing levels of aspartate transaminase and alanine transaminase in serum.7 Due to the various potential health benefits of pterostilbene, a good understanding of its metabolic fate is crucial. However, as far as we know, the in vivo and in vitro metabolism study of pterostilbene has been poorly understood.
Drugs and their products after metabolism in vivo are the intrinsic basis for the treatment of diseases. The types and structural complexity of drug metabolites are determined by their metabolic reactions, including hydrolysis, mono-/di-oxygenation, cleavage, and coupling reactions.8 One study on pharmacokinetics reported that the in vivo biological activity of equimolar doses of pterostilbene may be greater than that of resveratrol.9 In spite of this higher bioavailability, plasma concentrations of pterostilbene phase II metabolites are much higher than the concentration of the parent compound. After that, in Jenifer Trepiana’s previous metabolic research on pterostilbene, pterostilbene-4′-O-glucuronid and pterostilbene-4′-O-sulfate had an antisteatotic effect by incubating the in vitro model.1 In general, various processes governing drug metabolism in the body and the compounds are very complex and dynamic and often involve multiple organs, such as the gut and liver.10 However, the current research on pterostilbene metabolism was less reported and the metabolite pathway was incomplete. In the long run, to better understand metabolic action and promote research of the further potential therapeutic applications, the in vivo and in vitro metabolism study of pterostilbene is of great importance.
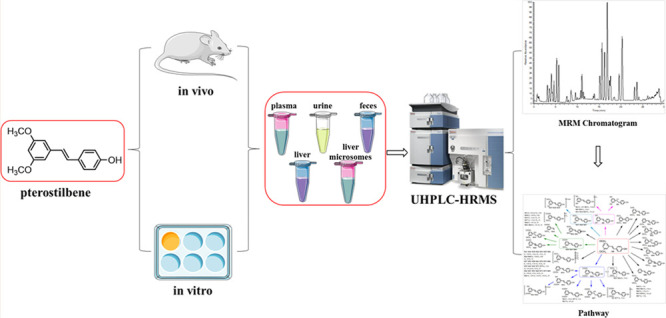
Recently, ultrahigh-performance liquid chromatography coupled with mass spectrometry (UHPLC–MS), especially high-resolution mass spectrometry (HRMS), combined with pattern recognition analysis has become an unbiased discrimination method to identify bioactive compounds of drugs in vivo and vitro.11,12 In order to detect as many pterostilbene metabolites as possible, in this study, various data-processing techniques, including multiple mass defect filter (MMDF) and full scan–parent ion list–dynamic exclusion (FS-PIL-DE), were used to identify compounds in complex environments.13,14 Additionally, diagnostic product ion (DPI) analysis could provide a criterion to judge the target constituents detected into certain chemical families.14 As such, structurally related compounds that are part of the same biosynthetic class often exhibit common key MS/MS fragmentation characteristics, including shared product ions and/or neutral losses.15 The ability to screen complex samples for compounds that possess class-specific product ions and/or neutral losses is a powerful strategy to detect entire classes of compounds, potentially leading to the discovery of new natural metabolites. In addition, a diagram that summarizes the presently developed analytical strategy and methodology for the detection and identification of pterostilbene metabolites is shown in Figure 1.
Figure 1.

Summary diagram of the developed strategy and methodology.
2. Materials and Methods
2.1. Chemicals and Materials
Pterostilbene (purity ≥99.99%, MUST-21052207) was provided by Chengdu Must Biotechnology Co. Ltd. (Sichuan, China); HPLC-grade acetonitrile, methanol, and formic acid were purchased from Thermo Fisher Scientific (Fair Lawn, NJ, USA). The deionized water used throughout the experiment was purchased from Watsons (Guangzhou, China). Rat liver microsomes were obtained from Xin Run Biotechnology Co., Ltd. (Wuxi, China); Oasis HLB C18-Low solid-phase extraction (SPE) cartridges (500 mg/6 mL, 60 μm, 149 Å) were purchased from Waters Corporation (Milford, USA). Nicotinamide adenine dinucleotide phosphate (NADPH) and MgCl2 were purchased from Shanghai Macklin Biochemical Co., Ltd. (Shanghai, China). Six-well plates were obtained from Corning Incorporated-Life Science (Jiangsu, China).
2.2. Animals and Drug Administration
Six male Sprague–Dawley rats (200 ± 10 g) were obtained from Jinan Pengyue Experimental Animal Breeding Company (Shandong, China, SCXK(RU)2019003). All rats were housed under standard animal room conditions (temperature 24 ± 2 °C, humidity 55–60%, and 12/12 h light/dark cycles) with food and water ad libitum for 1 week before experimental interventions. After 1 week of adaptation, the rats were randomly divided into drug groups (n = 3) for test plasma, urine, and feces and the control group (n = 3) for blank plasma, urine, feces, and liver. All rats were fasted for 12 h with free access to water prior to the experiment. Pterostilbene was suspended in normal saline and given at a dose of 250 mg/kg body weight orally to rats in the drug group. The normal saline solution (2 mL) was administered to rats in the control group. The above animal protocols were approved by the Institutional Animal Care and Use Committee at Binzhou Medical University (No: 2021-087).
2.3. Preparation of Liver Microsomes and Microsomal Incubation
The in vitro metabolism study of pterostilbene was developed in rat liver microsomes (purchased from NEWGAINBIO). The microsomes used in this paper are subcellular components of rat liver organelles prepared by differential centrifugation, which are part of the organelle endoplasmic reticulum and have intact phase I metabolic enzymes, phase II metabolic enzymes, and esterases. A reaction mixture was carried out in a 1 M phosphate buffer (pH = 7.4) containing rat liver microsomes (1 mg/mL) and MgCl2 (3 mM). Pterostilbene was diluted with the above solvent to a concentration of 0.1 mg/mL. To a separate 6-well plate, 900 μL of above mixture was added to a drug well. Simultaneously, incubation without pterostilbene served as blank control and incubation absent from NADPH as negative control. Preincubation was performed at 37 °C for 5 min before adding 100 μL of NADPH (25 mg/mL) to start the reaction. The reactions were incubated for 5, 10, 15, 30, 45, 60, 120, and 240 min at 37 °C. After that, 100 μL of different system solutions was removed and terminated using 200 μL of cold acetonitrile. Finally, the acetonitrile solutions were collected and dried under nitrogen at room temperature.
2.4. Biological Sample Preparation
Blood samples (0.5 mL) were taken from the suborbital venous plexus of rats at 0.5, 1, 1.5, 2, 4, and 6 h postadministration.16 Each sample was centrifuged at 3500g for 10 min to obtain plasma samples. Additionally, urine and fecal samples were collected 0–24 h after administration. All homogeneous biological samples from the same group were finally merged into a collective sample. Different processing methods were used to pretreat the collected plasma. The first method (method I) was performed to prepare biological samples by SPE. The second method (method II) and the third method (method III) used methanol and acetonitrile to precipitate the supernatants of the plasma samples, respectively. The proportion of methanol and acetonitrile to these samples was 1:3. Thereafter, these samples were precipitated for 30 min and then centrifuged at 3500g for 15 min to obtain the solutions after treatment and dried under nitrogen at room temperature.
Plasma samples and urine samples (1 mL) were added to the SPE cartridges pretreated with methanol (5 mL) and deionized water (5 mL). Then, the SPE cartridges were successively washed with deionized water (5 mL) and methanol (3 mL). The methanol elution was collected and evaporated using nitrogen at room temperature.
The freeze-dried fecal samples (1.0 g) were ultrasonically extracted with deionized water (5.0 mL) for 15 min and then centrifuged at 5000g for 15 min. The supernatants (1 mL) were added to the pretreated SPE cartridges, and then, the same process as that for plasma samples was conducted. The methanol eluent was collected and dried under nitrogen at room temperature.
At the end of the administration, two groups of rats were sacrificed in parallel. The rat liver tissue was quenched in liquid nitrogen and stored at −80 °C. Liver tissue (1 g) was ground with 10 mL of physiological saline and centrifuged at 5000g for 15 min. The supernatants (1 mL) were added to the pretreated SPE cartridges, and then, the same process as that for plasma samples was conducted.
All samples from plasma, feces, urine, liver, and liver microsomes were redissolved with 300 μL of methanol solution. After centrifuging at 20,000g for 15 min, the supernatant (3 μL) was injected into the LC/MS system for analysis.
2.5. Instrument and Conditions
The chromatographic separation was performed using a Dionex Ultimate 3000 UHPLC system (Thermo Electron, Bremen, Germany) and Vanquish column compartment equipped with a Vanquish auto-sampler. Separation was performed using a Waters ACQUITY BEH C18 column (100 × 2.1 mm, 1.9 μm). The mobile phases were composed of two systems: acetonitrile (A) and water with 0.1% formic acid (B). Metabolites needed to be eluted using a linear gradient: 0–5 min, 95–70% B; 5–10 min, 70–50% B; 10–27 min, 50–10% B; 27–27.1 min, 10–95% B; and 27.1–30 min, 95%B. The flow rate was set to 0.3 mL/min, and the injection volume was 3 μL.
The ESI-MS/MS spectrum was obtained using a Q-Exactive plus mass spectrometer (Thermo Electron, Bremen, Germany). All samples were analyzed in negative and positive ion modes with the tune method set as follows: sheath gas (nitrogen) flow rate of 45 arb, auxiliary gas (nitrogen) flow rate of 10 arb, capillary temperature of 320 °C, spray voltage of 3800/3500 V (+/−), capillary voltage of 25 V, and radio frequency lens voltage of 50 V. Metabolites were detected using full-scan MS analysis in a mass range of m/z 80–1200 at a resolving power of 70,000.
2.6. Peak Selections and Data Processing
A Thermo Xcalibur 2.1 workstation was used for data acquisition and processing. In order to obtain as many ESI-MS/MS fragment ions of pterostilbene metabolites as possible, the peaks detected with intensity over 10,000 were selected for identification. The accurate mass of chemical formulas attributed to all parent ions of the selected peaks was calculated using a formula predictor by setting the parameters as follows: C [0–35], H [0–40], O [0–16], S [0–5], N [0–5], and ring double bond (RDB) equivalent value [0–15]. The accurate mass measurements were set within a mass error of ±5 ppm.
3. Results and Discussion
3.1. DPI Construction Based on the Mass Fragmentation Behaviors of Pterostilbene
To provide guidance for the subsequent analysis of metabolites in vivo and in vitro, DPIs could be used as an important basis for structural identification of metabolites. DPIs of pterostilbene were determined based on the comprehensive ESI-MS2 information of the pterostilbene standard via UHPLC-HRMS analysis. Pterostilbene could generate its [M + H]+ and [M – H]− ions at m/z 257.11615 and m/z 255.10251, respectively. In negative ion mode, it would further afford a series of DPIs at m/z 240 ([M – H–CH3]−), m/z 225 ([M – H–2CH3]−), m/z 197 ([M – H–2CH3–CO]−), and m/z 117 ([M – H–2CH3–C6H4O2]−). In positive ion mode, the DPIs were detected at m/z 242 ([M + H–CH3]+), m/z 227 ([M + H–2CH3]+), m/z 137 ([M + H–2CH3–C6H6O + 2H]+), and m/z 121 ([M + H–2CH3–C6H6O + 2H–O]+). The fragmentation behavior and the ESI-MS2 spectra of pterostilbene in the negative and positive ion mode are shown in Figure 2.
Figure 2.

(A) Mass fragmentation behavior of pterostilbene (P for positive and N for negative); The ESI-MS/MS spectra of pterostilbene in (B) positive and (C) negative ion modes.
Therefore, the metabolites of pterostilbene might yield fragment ions at m/z 240, m/z 225, m/z 197, or m/z 117, which could be used for its rapid identification in negative ion mode. The fragment ions at m/z 242, m/z 226, m/z 137, or m/z 121 could be used for the identification in positive ion mode. Based on the preliminary judgment of the addition and subtraction of characteristic fragments, M0 was presumed to be pterostilbene.
3.2. Establishment of the Analytical Strategy
In this study, an efficient and integrated strategy was established for the comprehensive screening and characterization of pterostilbene metabolites using a UHPLC-Q-Exactive Plus MS coupled with postacquisition data-mining processing techniques. First, a full mass scan was performed with a resolution of 70,000. Meanwhile, high-resolution extracted ion chromatography was adopted to extract the candidates from the high-quality, accurate raw mass data both in negative and positive ion modes. Then, data mining was processed based on common biotransformation reactions as well as the reported metabolites in the literature.17 Subsequently, the ions that we were interested in were put into PIL to obtain more comprehensive MS2 information for structural identification. Finally, the structures of the compounds were elucidated according to the accurate mass measurement, fragmentation patterns, diagnostic product ions, and literature reports.
Furthermore, to facilitate the structural elucidation of constituents in pterostilbene, five byproduct centers were summarized based on the mass spectrometric cracking rules reported in the literature and the cracking information of reference substances.
3.3. Implementation of MMDF Data-Mining Methods
Setting MMDF templates is a key step, especially for low levels of unpredicted metabolites. Five templates were used in parallel to screen the metabolites: (1) the parent drug template (m/z 256.12) and its conjugation templates (m/z 273.11 for hydroxylation, m/z 335.06 for sulfate conjugation, m/z 431.13 for glucuronide conjugation, and m/z 419.17 for glucosylation); (2) resveratrol (m/z 226.07) and its conjugation templates; and (3) pinostilbene (m/z 243.10) and its conjugation templates. In the later stage of screening and identification, the template would adjust in time when a new substance was found during the screening process that could be used as a metabolic template or when the template that we set could not comprehensively screen out metabolites.
3.4. Identification of Pterostilbene Metabolites
A total of 88 pterostilbene metabolites (pterostilbene included) were detected and characterized from rat urine, plasma, and fecal samples by means of the UHPLC-Q-Exactive method coupled with the established strategy. Among them, 38 metabolites were found in rat urine, 50 metabolites were detected in rat plasma, 4 metabolites were characterized from rat feces, 12 metabolites were discovered in the rat liver, and 15 metabolites were found in rat liver microsomes. The correlative data are summarized in Table 1.
Table 1. Summary of Pterostilbene Metabolites in Rat Urine, Plasma, Feces, Liver, and Liver Microsomesa.
| peak | tR (min) | ion mode | formula [M – H]−/[M + H]+ | theoretical mass (m/z) | experimental mass (m/z) | RDB | error (ppm) | MS/MS fragment ions | identification | U | P | F | L | M |
|---|---|---|---|---|---|---|---|---|---|---|---|---|---|---|
| M0* | 12.34 | P | C16H17O3 | 257.11722 | 257.11627 | 8.5 | –3.698 | 257.12(100), 242.09(13.59), 137.06(9.66), 121.06(7.81) | pterostilbene | + | ||||
| 12.36 | N | C16H15O3 | 255.10267 | 255.10252 | 9.5 | 3.721 | 255.10(100), 240.08(66.34), 116.93(12.00), 197.06(5.35), 92.99(0.53) | + | ||||||
| M1 | 1.51 | N | C16H13O12S2 | 460.98543 | 460.98352 | 10.5 | –1.678 | 219.00(100), 80.96(17.78), 79.96(14.61), 460.98(13.20) | disulfonation, dioxygenation | + | ||||
| M2 | 2.32 | N | C21H18O8NS | 444.07590 | 444.07440 | 13.5 | –0.819 | 96.96(100), 116.93(5.58), 346.11(3.64), 399.02(1.52), 79.96(1.25), 241.06(0.85), 444.08(0.64) | dual methylene ketogenic, N-acety-l-cysteine product | + | ||||
| M3 | 3.40 | P | C14H13O4 | 245.08082 | 245.08023 | 8.5 | –2.47 | 245.08(100), 107.05(81.18), 135.04(76.82), 228.07(7.12) | resveratrol oxygenation | + | ||||
| M4 | 4.53 | N | C22H19O11 | 459.09330 | 459.09424 | 13.5 | 4.47 | 283.06(100), 175.02(24.54), 459.09(9.56), 241.05(2.46) | dual methylene ketogenic, glucuronidation | + | + | |||
| 4.84 | P | C22H21O11 | 461.10785 | 461.10684 | 12.5 | –2.164 | 285.07(100), 133.09(9.16), 177.11(3.04), 270.05(3.41), 461.11(2.48) | + | ||||||
| M5 | 4.65 | N | C26H27O15 | 579.13557 | 579.13641 | 13.5 | 3.391 | 113.02(100), 403.10(89.72), 579.14(75.32), 227.07(66.43), 175.02(18.91) | resveratrol dual glucuronidation | + | ||||
| M6 | 5.07 | P | C14H15O4 | 247.09652 | 247.09615 | 7.5 | –1.358 | 137.06(100), 123.04(49.56), 247.09(39.13), 211.13(25.30) | resveratrol hydration | + | ||||
| M7 | 5.31 | P | C22H23O10 | 447.12855 | 447.12759 | 11.5 | –2.199 | 285.07(100), 253.05(2.82), 225.05(2.49), 447.13(1.99) | dual methylene ketogenic, glucosylation | + | ||||
| M8 | 5.41 | N | C20H19O9 | 403.10347 | 403.10400 | 11.5 | 4.072 | 227.07(100), 403.10(80.70), 175.02(25.42), 185.06(6.87), 143.05(1.53) | resveratrol glucuronidation/isomer | + | ||||
| M9 | 5.45 | P | C14H13O3 | 229.08582 | 229.08569 | 8.5 | –3.401 | 229.09(100), 135.04(82.52), 107.05(72.16), 211.07(11.28) | resveratrol | + | + | |||
| 5.46 | N | C14H11O3 | 227.07137 | 227.07079 | 9.5 | 2.287 | 227.07(100), 185.06(21.18), 143.05(8.92), 159.08(4.00) | + | + | |||||
| M10 | 5.50 | N | C9H7O4 | 179.03513 | 179.03435 | 6.5 | 2.596 | 134.06(100), 179.03(16.47), 103.92(4.30).93.03(3.72) | 3-methoxy-5-vinylbenzoic acid | + | + | + | ||
| M11 | 5.52 | N | C14H11O6S | 307.02817 | 307.02847 | 9.5 | 4.510 | 227.07(100), 307.03(47.46), 79.96(11.53), 185.06(1.17) | resveratrol sulfation/isomer | + | ||||
| 5.53 | P | C14H13O6S | 309.04272 | 309.04205 | 8.5 | –2.217 | 229.09(100), 309.04(20.00), 107.05(2.41), 137.06(1.77) | + | ||||||
| M12 | 5.55 | P | C15H13O4 | 257.08079 | 257.08017 | 9.5 | –2.588 | 123.04(100), 257.08(68.34), 163.04(50.10), 95.05(23.20), 229.08(3.35) | 3-hydroxy-5-(4-hydroxystyryl) benzoic acid | + | + | |||
| M13 | 5.56 | N | C21H19O10 | 431.0984 | 431.09891 | 12.5 | 3.797 | 431.10(100), 113.02(63.79), 255.07(42.66), 175.02(22.03) | demethylation, methylene ketogenic, glucuronidation | + | ||||
| 5.57 | P | C21H21O10 | 433.11295 | 433.11182 | 11.5 | –2.547 | 257.08(100), 176.11(7.00), 113.02(5.90), 137.02(4.06) | + | ||||||
| M14 | 5.67 | N | C14H11O6S | 307.02817 | 307.02832 | 9.5 | 4.022 | 227.07(100), 151.02(52.38), 307.03(48.04) | resveratrol sulfation/isomer | + | ||||
| M15 | 5.83 | P | C14H15O3 | 231.10212 | 231.10114 | 7.5 | –1.864 | 137.06(100), 107.05(59.03), 231.10(20.82), 93.07(5.30) | 3′,5’-dimethoxybiphenyl-4-ol | + | ||||
| M16 | 5.83 | P | C16H15O3 | 255.10152 | 255.10107 | 9.5 | –1.963 | 121.06(100), 137.06(28.21), 255.10(15.83), 145.06(13.49) | hydroxylation, dehydration | + | ||||
| M17 | 5.97 | N | C16H11O8S | 363.01800 | 363.01837 | 11.5 | 4.010 | 283.06(100), 363.02(34.99), 79.96(10.56), 240.04(3.38) | dual methylene ketogenic, sulfation | + | ||||
| M18 | 6.21 | P | C16H15O6 | 303.08629 | 303.08560 | 9.5 | –2.358 | 303.09(100), 153.02(97.96), 177.05(80.68), 137.06(5.15), 256.10(4.61) | methylene ketogenic, dihydroxylation | + | ||||
| M19 | 6.23 | N | C21H21O9 | 417.11913 | 417.11963 | 11.5 | 3.887 | 113.02(100), 417.12(82.37), 175.02(35.34), 241.09(28.84) | demethylation, glucuronidation | + | + | + | ||
| M20 | 6.33 | P | C20H21O9 | 405.11802 | 405.11694 | 10.5 | –2.638 | 229.08(100), 135.04(35.98), 107.05(28.50), 405.12(8.03) | resveratrol glucuronidation/isomer | + | ||||
| M21 | 6.35 | N | C22H23O10 | 447.12967 | 447.13016 | 11.5 | 2.322 | 271.06(100), 113.02(93.37), 175.02(62.74), 447.13(22.42) | hydroxylation, glucuronidation/isomer | + | ||||
| M22 | 6.44 | P | C15H15O2 | 227.10662 | 227.10617 | 8.5 | –2.141 | 184.10(100), 227.11(74.48), 67.05(23.48), 109.10(15.09) | monodemethoxy | + | ||||
| M23 | 6.44 | P | C21H24O6NS | 418.13192 | 418.13068 | 10.5 | –2.881 | 130.05(100), 162.02(43.43), 287.07(9.93), 256.11(6.38), 121.00(6.09), 418.13(3.91) | N-acety-l-cysteine product | + | ||||
| M24 | 6.49 | P | C16H17O5 | 289.10702 | 289.10641 | 8.5 | –2.214 | 107.05(100), 289.11(24.45), 256.07(4.87), 241.05(2.71) | dihydroxylation/isomer | + | ||||
| N | C16H15O5 | 287.09247 | 287.09250 | 9.5 | 2.339 | 287.09(100), 108.02(54.06), 272.07(13.20), 257.04(4.80) | + | |||||||
| M25 | 6.51 | N | C16H15O5 | 287.09253 | 287.09268 | 9.5 | 4.458 | 287.09(100), 108.02(54.06), 257.04(4.80), 271.06(4.39) | methylene ketogenic, hydration | + | ||||
| M26 | 6.58 | P | C21H24O6NS | 418.13192 | 418.13095 | 10.5 | –3.547 | 130.05(100), 162.02(41.99), 256.10(6.16), 418.13(4.47) | N-acety-l-cysteine product | + | ||||
| M27 | 6.62 | N | C17H17O4 | 285.11317 | 285.11325 | 9.5 | 3.909 | 241.12(100), 285.11(54.35), 271.06(3.68), 106.04(8.73) | hydroxylation, methylation/isomer | + | + | |||
| M28 | 6.85 | N | C21H21O9 | 417.11913 | 417.11981 | 11.5 | 4.319 | 417.12(100), 113.02(55.27), 241.09(33.51), 175.02(13.68) | demethylation, glucuronidation | + | ||||
| M29 | 6.91 | N | C14H11O6S | 307.02817 | 307.02856 | 9.5 | 4.803 | 227.07(100), 307.03(55.57), 79.96(7.30), 185.06(4.75) | resveratrol sulfation/isomer | + | + | + | ||
| M30 | 7.10 | P | C22H27O8 | 419.17002 | 419.16977 | 9.5 | –0.654 | 243.10(100), 419.17(10.54), 121.06(6.28), 255.10(5.67) | glucosylation | + | ||||
| M31 | 7.14 | P | C15H15O3 | 243.10159 | 243.10104 | 8.5 | –2.184 | 243.10(100), 121.06(29.71), 225.09(4.99), 137.06(4.19) | pinostilbene | + | ||||
| M32 | 7.25 | P | C21H21O10 | 433.11295 | 433.11469 | 11.5 | 4.079 | 433.11(100), 257.08(94.95), 113.02(68.61), 175.02(26.93) | demethylation, methylene ketogenic, glucuronidation | + | ||||
| M33 | 7.26 | N | C22H21O10 | 445.11403 | 445.11478 | 12.5 | 4.171 | 269.08(100), 113.02(77.46), 175.02(34.47), 445.11(17.29) | methylene ketogenic, glucuronidation | + | ||||
| M34 | 7.32 | P | C16H13O5 | 285.07575 | 285.07516 | 10.5 | –2.070 | 285.07(100), 197.06(1.49), 121.06(1.76), 167.03(0.94) | dual methylene ketogenic | + | + | |||
| M35 | 7.36 | N | C16H15O7S | 351.05437 | 351.05447 | 9.5 | 1.771 | 256.07(100), 271.10(92.99), 241.05(82.48), 351.05(76.82), 79.96(64.76) | hydroxylation, sulfation/isomer | + | ||||
| M36 | 7.39 | P | C22H25O10 | 449.14422 | 449.14307 | 10.5 | –2.568 | 273.11(100), 449.14(32.05), 137.06(14.69), 121.06(5.59) | hydroxylation, glucuronidation/isomer | + | ||||
| M37 | 7.48 | P | C17H17O5 | 301.10699 | 301.10641 | 9.5 | –2.126 | 167.07(100), 301.11(17.86), 241.08(3.06), 270.09(2.45) | methoxy | + | ||||
| M38 | 7.50 | N | C22H23O10 | 447.12967 | 447.13000 | 11.5 | 3.191 | 113.02(100), 447.13(66.62), 256.07(65.94), 271.10(51.26), 241.05(48.49), 175.02(32.52) | hydroxylation, glucuronidation/isomer | + | ||||
| M39 | 7.63 | N | C21H21O9 | 417.11913 | 417.11954 | 11.5 | 3.671 | 113.02(100), 241.09(73.73), 417.12(61.42), 175.02(50.89) | demethylation, glucuronidation | + | ||||
| M40 | 7.72 | N | C15H13O3 | 241.08703 | 241.08635 | 9.5 | 1.780 | 241.09(100), 225.06(29.49), 197.06(3.75), 79.96(2.80) | pinostilbene | + | ||||
| M41 | 7.78 | N | C16H15O7S | 351.05437 | 351.05420 | 9.5 | 1.002 | 271.10(100), 351.05(87.68), 255.07(38.30), 79.96(21.59) | hydroxylation, sulfation/isomer | + | ||||
| M42 | 7.85 | N | C16H17O5 | 289.10807 | 289.10822 | 8.5 | 4.047 | 289.11(100), 122.04(46.30), 152.05(33.87), 137.02(28.01) | olefin hydration | + | ||||
| M43 | 7.91 | N | C16H15O4 | 271.09757 | 271.09753 | 9.5 | 3.853 | 271.10(100), 256.07(21.52), 241.05(8.95), 225.15(5.49) | hydroxylation/isomer | + | ||||
| 7.92 | P | C16H17O4 | 273.11212 | 273.11154 | 8.5 | –4.188 | 273.11(100), 137.06(28.71), 149.06(21.79), 121.06(7.47) | + | ||||||
| M44 | 8.01 | P | C18H18O5N | 328.11799 | 328.11835 | 10.5 | 1.222 | 328.12(100), 95.09(7.00), 151.07(6.98), 57.07(4.20) | methylene ketogenic, glycine binding | + | ||||
| M45 | 8.02 | P | C16H17O7S | 353.06892 | 353.06799 | 8.5 | –2.719 | 273.11(100), 353.07(84.38), 137.06(31.10), 164.08(16.35) | hydroxylation, sulfation/isomer | + | + | |||
| M46 | 8.14 | N | C22H23O10 | 447.12967 | 447.12994 | 11.5 | 1.830 | 271.10(100), 113.02(68.71), 447.13(61.48), 175.02(25.65) | hydroxylation, glucuronidation/isomer | + | + | |||
| P | C22H25O10 | 449.14422 | 449.14319 | 10.5 | –3.522 | 273.11(100), 449.14(30.07), 137.06(16.09), 164.08(8.50) | + | |||||||
| M47 | 8.49 | P | C16H17O4 | 273.11212 | 273.11148 | 8.5 | –2.400 | 273.11(100), 137.06(28.43), 151.07(5.88), 121.06(5.49) | hydroxylation/isomer | + | ||||
| M48 | 8.58 | P | C16H19O4 | 275.12782 | 275.12698 | 7.5 | –2.928 | 275.13(100), 165.09(99.19), 137.06(95.40), 105.07(14.33), 124.05(5.87) | hydration | + | ||||
| M49 | 8.75 | P | C16H17O5 | 289.10702 | 289.10632 | 8.5 | –2.525 | 107.05(100), 121.03(33.04), 289.11(25.37), 256.07(5.97) | dihydroxylation/isomer | + | ||||
| N | C16H15O5 | 287.09247 | 287.09262 | 9.5 | 4.249 | 287.09(100), 108.02(62.27), 272.07(33.81), 137.02(4.26) | + | |||||||
| M50 | 8.77 | P | C16H15O4 | 271.09642 | 271.09601 | 9.5 | –1.754 | 271.10(100), 197.06(8.63), 243.10(6.32), 213.09(5.49) | methylene ketogenic/isomer | + | ||||
| M51 | 8.81 | P | C17H19O4 | 287.12772 | 287.12714 | 8.5 | –2.248 | 287.13(100), 255.10(14.36), 137.06(9.37), 241.08(3.17) | hydroxylation, methylation/isomer | + | ||||
| M52 | 8.86 | P | C16H15O4 | 271.09757 | 271.09714 | 9.5 | 0.392 | 271.10(100), 255.07(69.93), 240.04(12.26), 197.06(2.38) | hydroxylation/isomer | + | + | |||
| M53 | 8.86 | N | C22H23O10 | 447.12967 | 447.13010 | 11.5 | 3.414 | 271.10(100), 447.13(59.09), 113.02(48.71), 175.02(18.55) | hydroxylation, glucuronidation/isomer | + | + | |||
| M54 | 8.86 | N | C22H23O9 | 431.13477 | 431.13531 | 11.5 | 2.558 | 113.02(100), 431.14(77.39), 175.02(38.65), 255.10(36.06) | glucuronidation/isomer | + | ||||
| M55 | 8.88 | P | C22H25O10 | 449.14422 | 449.14316 | 10.5 | –2.368 | 273.11(100), 449.14(31.38), 137.06(20.11), 113.02(7.62) | hydroxylation, glucuronidation/isomer | + | + | |||
| M56 | 9.06 | P | C17H17O4 | 285.11249 | 285.11179 | 9.5 | –1.212 | 285.11(100), 225.09(32.68), 271.10(12.68), 242.09(5.80) | 4-carbonylation | + | ||||
| M57 | 9.11 | P | C16H15O6 | 303.08635 | 303.08563 | 9.5 | –2.259 | 137.06(100), 303.09(67.75), 258.08(5.85), 241.09(5.57) | dual methylene ketogenic, hydration | + | ||||
| M58 | 9.15 | P | C17H19O4 | 287.12772 | 287.12692 | 8.5 | –4.925 | 287.13(100), 137.06(26.82), 255.10(14.36), 225.09(12.55) | hydroxylation, methylation/isomer | + | ||||
| M59 | 9.16 | P | C16H19O3 | 259.13292 | 259.13220 | 7.5 | –4.706 | 121.06(100), 165.09(95.14), 259.13(68.47), 93.07(8.65) | hydrogenation | + | ||||
| M60 | 9.22 | N | C16H15O4 | 271.09757 | 271.09775 | 9.5 | 4.665 | 271.10(100), 255.07(61.86), 240.04(11.63), 197.06(2.63) | hydroxylation/isomer | + | ||||
| M61 | 9.25 | P | C22H25O9 | 433.14929 | 433.14801 | 10.5 | –2.998 | 257.12(100), 433.15(19.61), 121.06(5.92), 225.09(5.74), 242.09(5.24) | methylene ketogenic, glucosylation | + | ||||
| M62 | 9.25 | P | C17H19O4 | 287.12772 | 287.12695 | 8.5 | –4.820 | 287.13(100), 255.10(14.99), 137.06(11.40), 225.09(7.98), 121.06(7.87) | hydroxylation, methylation/isomer | + | ||||
| M63 | 9.25 | P | C22H25O9 | 433.14932 | 433.14801 | 10.5 | –4.264 | 257.12(100), 433.15(19.61), 113.02(6.69), 121.06(5.92), 225.09(5.74) | glucuronidation/isomer | + | + | |||
| 9.26 | N | C22H23O9 | 431.13477 | 431.13458 | 11.5 | 2.137 | 113.02(100), 255.10(77.04), 175.02(36.52), 431.13(29.84), 240.08(25.71) | + | + | |||||
| M64 | 9.28 | P | C22H25O9 | 433.14929 | 433.14774 | 10.5 | –3.622 | 257.12(100), 433.15(20.99), 269.12(11.56), 225.09(5.56) | methylene ketogenic, glucosylation | + | ||||
| M65 | 9.28 | P | C18H19O4 | 299.12689 | 299.12689 | 9.5 | –2.994 | 299.13(100), 257.12(9.00), 121.06(8.55), 240.11(8.14) | 4-pterostilbene acetate | + | ||||
| M66 | 9.30 | P | C16H17O6 | 305.10192 | 305.10089 | 8.5 | –3.522 | 245.08(100), 217.09(57.20), 189.09(51.97), 305.10(18.36) | trihydroxy-pterostilbene | + | + | |||
| M67 | 9.36 | P | C15H15O3 | 243.10152 | 243.10095 | 8.5 | –2.554 | 243.10(100), 121.06(27.74), 242.09(15.01), 225.09(7.09) | pinostilbene | + | + | + | ||
| 9.37 | N | C15H13O3 | 241.08697 | 241.08690 | 9.5 | 4.062 | 241.09(100), 225.05(72.28), 197.06(26.26), 92.99(5.12) | + | ||||||
| M68 | 9.72 | P | C16H13O4 | 269.08079 | 269.08002 | 10.5 | –3.030 | 269.08(100), 137.06(2.60), 255.06(2.30), 226.06(2.07) | methylene ketogenic, dehydrogenation | + | + | |||
| M69 | 9.77 | P | C16H15O4 | 271.09649 | 271.0961 | 9.5 | –3.445 | 272.10(100), 271.10(98.37), 243.10(52.62), 228.08(19.54) | methylene ketogenic/isomer | + | ||||
| M70 | 9.78 | P | C17H19O4 | 287.12772 | 287.12695 | 8.5 | –2.910 | 287.13(100), 255.10(13.26), 137.06(9.40), 241.08(2.88) | hydroxylation, methylation/isomer | + | ||||
| M71 | 9.82 | P | C16H17O7S | 353.06892 | 353.06775 | 8.5 | –3.399 | 273.11(100), 353.07(79.52), 137.06(35.10), 151.07(8.69) | hydroxylation, sulfation/isomer | + | ||||
| M72 | 9.87 | N | C16H15O4 | 271.09757 | 271.09705 | 9.5 | 0.060 | 271.10(100), 255.07(70.37), 240.04(15.15), 197.06(3.45) | hydroxylation/isomer | + | ||||
| M73 | 9.89 | N | C16H15O6S | 335.05947 | 335.05930 | 9.5 | 2.730 | 255.10(100), 335.06(54.15), 240.18(25.08), 79.96(4.19) | sulfation | + | ||||
| 9.95 | P | C16H17O6S | 337.07402 | 337.07288 | 8.5 | –3.428 | 257.12(100), 337.07(60.24), 242.09(9.07), 225.09(8.34) | + | ||||||
| M74 | 9.91 | N | C15H11O3 | 239.07140 | 239.07123 | 10.5 | 4.012 | 240.08(100), 239.07(92.44), 197.06(66.71), 211.08(9.38), 169.08(9.38) | dual methylene ketogenic, decarboxylation | + | ||||
| M75 | 9.95 | P | C16H17O4 | 273.11212 | 273.11136 | 8.5 | –2.840 | 273.11(100), 137.06(26.07), 151.07(6.02), 121.06(6.00) | hydroxylation/isomer | + | ||||
| M76 | 10.00 | N | C17H17O4 | 285.11325 | 285.11295 | 9.5 | 2.857 | 270.09(100), 285.11(45.27), 271.06(21.41), 241.18(9.57) | hydroxylation, methylation/isomer | + | ||||
| M77 | 10.20 | N | C21H18O7NS | 428.08100 | 428.08041 | 13.5 | 1.310 | 428.08(100), 79.96(38.59), 347.99(36.96), 267.06(19.29) | dual methylene ketogenic, N-acety-l-cysteine product | + | ||||
| M78 | 10.26 | N | C16H15O6S | 335.05947 | 335.06000 | 9.5 | 3.182 | 255.10(100), 335.06(56.25), 240.08(22.67), 79.96(3.84) | sulfation | + | + | + | ||
| M79 | 10.28 | N | C16H15O7S | 351.05437 | 351.05444 | 9.5 | 1.685 | 271.10(100), 351.05(70.14), 78.96(15.70), 255.07(15.23) | hydroxylation, sulfation/isomer | + | ||||
| M80 | 10.38 | N | C16H13O4 | 269.08187 | 269.08206 | 10.5 | 4.551 | 254.06(100), 269.08(50.13), 255.10(23.79), 239.03(28.03) | methylene ketogenic/isomer | + | ||||
| M81 | 10.59 | N | C17H15O4 | 283.09704 | 283.09784 | 10.5 | 4.785 | 283.10(100), 239.11(21.29), 151.02(17.19), 91.05(12.56) | 4-carbonylation | + | ||||
| M82 | 10.77 | N | C16H17O4 | 273.11327 | 273.11327 | 8.5 | 3.861 | 273.11(100), 122.04(50.63), 137.02(5.29), 256.07(1.43) | hydration | + | ||||
| 10.80 | P | C16H19O4 | 275.12782 | 275.12708 | 7.5 | –2.565 | 275.13(100), 165.09(99.47), 137.06(88.10), 123.04(81.32) | + | ||||||
| M83 | 10.91 | P | C16H17O4 | 273.11212 | 273.11139 | 8.5 | –2.730 | 273.11(100), 271.10(40.72), 225.09(31.86), 137.06(26.09) | hydroxylation/isomer | + | + | |||
| 10.92 | N | C16H15O4 | 271.09757 | 271.09747 | 9.5 | 3.632 | 271.10(100), 255.07(63.37), 240.04(11.65), 197.06(2.58) | + | + | |||||
| M84 | 11.29 | P | C22H25O10 | 449.14422 | 449.14621 | 10.5 | 4.423 | 393.08(100), 337.02(69.98), 449.15(29.39), 137.06(12.36), 175.02(5.07), 121.06(2.13) | hydroxylation, glucuronidation/isomer | + | ||||
| M85 | 11.67 | N | C16H13O3 | 253.08697 | 253.08682 | 10.5 | 3.553 | 209.10(100), 255.10(68.34), 240.08(46.38), 197.06(3.58) | dehydrogenation | + | + | |||
| M86 | 12.67 | P | C17H19O4 | 287.12772 | 287.12717 | 8.5 | –4.054 | 287.13(100), 137.06(25.73), 255.10(12.26), 121.06(9.62) | hydroxylation, methylation/isomer | + | ||||
| M87 | 13.50 | P | C17H19O3 | 271.13322 | 271.13211 | 8.5 | –2.807 | 271.13(100), 256.11(24.96), 121.03(11.31), 137.07(6.94) | 3,4′,5-trimethoxyresveratrol | + | ||||
| M88 | 13.83 | N | C14H13O | 197.09602 | 197.09567 | 8.5 | –2.139 | 105.03(100), 119.05(39.48), 197.10(22.70), 95.05(6.44) | 4-styrylphenol | + |
tR: retention time; RDB: unsaturation; U: urine; P: plasma; F: feces; L: liver; M: liver microsomes. +: detected; *: unambiguous identification by comparing with the reference substances.
3.4.1. Identification of Resveratrol Metabolites (M3, M5, M6, M8–M9, M11, M14, M20, and M29)
Metabolite M9 possessed deprotonated molecular ions at m/z 229.08569 (C14H13O3, −3.401 ppm) and m/z 227.07079 (C14H11O3, 2.287 ppm) in the positive and negative ion modes, respectively. This metabolite was 28 Da less massive than M0, indicating that it might be a di-demethylation product. In the positive MS2 spectra, the base peak ion at m/z 229 and the fragment ions at m/z 135 ([M + H–C6H6O]+) and m/z 107 ([M + H–C6H6O–CO–H]+) supported the initial conjecture. In the negative MS2 spectra, it generated the base peak ion at m/z 227 and the fragment ions at m/z 185 ([M – H–C2H2O]−), m/z 159 ([M – H–C2H2O–C2H2]−), and m/z 143 ([M – H–C2H2O–C2H2–O]−).18 Thus, M9 could be ultimately identified as resveratrol.
Resveratrol, the demethylated analogue of pterostilbene,1 generated its [M + H]+ and [M – H]− ions at m/z 229.08569 and m/z 227.07079, respectively, in the ESI-MS2 spectra. Its cleavage pathways and ESI-MS/MS spectra are shown in Figure 3. For example, the fragmentation behaviors of resveratrol in the negative ion mode involved two ESI-MS/MS cleavage pathways: (1) the product ion m/z 185 was fragmented by losing C2H2O (42 Da) from the ring of a. Hereafter, it would further give rise to the loss of C2H2O from the ring of b and yield the ion m/z 143. (2) In the cleavage of the ion m/z 185, ions m/z 159 and m/z 143 were formed by successively losing C2H2O and O, respectively. Based on the preliminary judgments of the addition and subtraction of characteristic fragments such as m/z 227 ± X, m/z 185 ± X, m/z 159 ± X, and m/z 143 ± X (X = molecular weight of substituent groups), a rough acquisition of the resveratrol metabolites was initially realized.18
Figure 3.

(A) Mass fragmentation behavior of resveratrol (P for positive and N for negative); ESI-MS/MS spectra of resveratrol in (B) positive and (C) negative ion modes.
M3 was eluted at 3.40 min with the ion at m/z 245.08023 (C14H13O4, −2.470 ppm) in the positive ion mode. Because being 16 Da more massive than M9, it was speculated to be an oxygenation product of resveratrol. In the ESI-MS/MS spectrum, the fragment ions at m/z 245 ([M + H]+), m/z 228 ([M + H–OH]+), m/z 107 ([M + H–C6H6O–CO–H]+), and m/z 135 ([M + H–C6H6O]+) were detected. Therefore, M3 could deduced as an oxygenation product of resveratrol. In addition, M6 was eluted at 5.07 min at m/z 247.09615 (C14H15O4, −1.358 ppm) in the positive ion mode. It was 18 Da more massive than M9. The presence of the fragment ions at m/z 247 ([M + H]+), m/z 211 ([M + H-2H2O]+), m/z 137 ([C8H8O2 + H]+), and m/z 123 ([C8H8O2 + H-CH2]+) revealed that M6 might be a hydration product of resveratrol.
M5 was eluted at 4.65 min at m/z 579.13641 (C26H27O15, 3.391 ppm) in negative ion mode. Compared to M9, it might combine with two molecules of glucuronic acid (GluA). In the MS/MS spectra, the double losses of 175 Da ([GluA–H]−) afforded the fragment ions at m/z 403 ([M – H–GluA]−) and m/z 227 ([M – H–2GluA]−). Similarly, M8 and M20 were 175 Da more massive than M9, and it is presumed that they might be conjugates of GluA. The fragment ions at m/z 175, m/z 227 ([M – H–GluA]−), and m/z 229 ([M + H–GluA]+) provided the above evidence for identification. Thus, M5, M8, and M20 were identified as the glucuronidation products of resveratrol.
M11, M14, and M29 were eluted at 5.52, 5.67, and 6.91 min, respectively. Three of them gave the same theoretical mass (m/z 307.02817) and formula (C14H11O6S) in the negative ion mode. They were 80 Da (SO3) more massive than M9. In the ESI-MS/MS spectrum, the base peak ion at m/z 227 ([M – H–SO3]−) and the fragment ions at m/z 307 ([M – H]−), m/z 80, and m/z 185 were obtained. To sum up, M11, M14, and M29 were interpreted as isomeric sulfated metabolites of resveratrol.
3.4.2. Identification of Hydroxylation Metabolites (M21, M24, M27, M35, M36, M38, M41, M43, M45–M47, M49, M51–M53, M55, M58, M60, M62, M66, M70–M72, M75, M76, M79, M83, M84, and M86)
The hydroxylation metabolites take up the majority of the results. In the positive ion mode, M0 combined with O, 2O, and 3O to form byproduct central ions m/z 273, m/z 289, and m/z 305, respectively. Afterward, the above product ions could combine with the glucuronide group, methyl group, and sulfonate group, which could be used for its rapid identification.
M21, M38, M46, and M53 were eluted at 6.35, 7.50, 8.14, and 8.86 min, respectively. The four metabolites possessed the common molecular formula of C22H23O10 with the experimental [M – H]− ions at m/z 447.13016, m/z 447.13000, m/z 447.12994, and m/z 447.13010 within mass errors of 5 ppm in negative ion mode. Comparing their molecular formula with that of M0, it is presumed that they might undergo hydroxylation and combine with GluA. In the ESI-MS/MS spectrum, the fragment ions at m/z 271 ([M – H–GluA]−) and at m/z 175 ([GluA–H]−) provided evidence for identifying the GluA group. Furthermore, M36, M55, and M84 were detected as similar metabolites. In the MS/MS spectra, the fragment ions at m/z 449 and m/z 273 ([M + H–GluA]+) explained the presence of the GluA group. M21, M36, M38, M46, M53, M55, and M84 were eventually identified as the oxygenation and glucuronidation products of pterostilbene.
Both in the positive and negative ion modes, metabolites M24 and M49 all have been eluted at 6.49 and 8.75 min, respectively. For instance, the fragment ions at m/z 289 and m/z 256 ([M + H-2O]+) appeared in positive ion mode. In addition, the DPIs at m/z 121 and m/z 241 all were characteristic fragment ions of the pterostilbene parent nucleus. Thus, they were di-oxygenated products of pterostilbene. In view of the above results, M66 was tentatively identified as the trioxidation product of pterostilbene.
M27 and M76 displayed a common formula C17H17O4, and the [M – H]− ions at m/z 285.11325 (mass error of 3.909 ppm) and m/z 285.11295 (mass error of 2.857 ppm) with retention times of 6.62 and 10.00 min, respectively. They were CH2O (30 Da) more than M0 in the negative mode. In the ESI-MS2 spectrum, the fragment ions at m/z 285, m/z 270 ([M – H–CH3]−), and m/z 241 ([M – H–CH2–OCH2]−) provided evidence for identifying a methoxy group. Moreover, M51, M58, M62, M68, and M86 possessed an identical formula C17H19O4 within mass errors of ±5 ppm in the positive ion mode. Fragment ions at m/z 287, m/z 255 ([M + H–OCH3]+), and m/z 225 ([M + H–OCH3–OCH2]+) illustrated a methoxy group. Based on this, the above seven compounds are predicted to be isomeric methylated and hydroxylated metabolites of pterostilbene.
M35, M41, and M79 showed a common formula C16H15O7S (m/z 351.05447, m/z 351.05420, m/z 351.05444, mass error within ±5 ppm) in the negative ion mode. The product ion at m/z 271 ([M – H–SO3]−) was attributed to the neutral loss of SO3, and the fragment ions at m/z 256 ([M – H–SO3–CH3]−) and the fragment ions at m/z 241 ([M – H–SO3–2CH3]−) were attributed to the successive loss of methyl groups. M45 and M71 exhibit similar cleavage processes in the positive ion mode. They possessed a similar fragmentation behavior. Thus, these compounds were tentatively identified as the isomeric oxygenation products of pterostilbene.
In negative ion mode, M43, M60, M72, and M83 had the same formula C16H15O4, showed [M – H]− ions at m/z 271.09753, m/z 271.09775, m/z 271.09705, and m/z 271.09747 (mass error within 5 ppm), and were 16 Da more than M0. They were speculated to be the mono-oxygenated product of pterostilbene. Meanwhile, the DPIs at m/z 255, m/z 240, and m/z 197 all were characteristic fragment ions of the M0 parent nucleus in the negative ion mode. At the same time, M47, M52, and M75 with the same formula C16H17O4 were detected in the positive ion mode. In the ESI-MS2 spectra, the DPIs at m/z 137 and m/z 121 were key ions for diagnosis of pterostilbene. Seven isomers, M43, M47, M52, M60, M72, M75, and M83, were the isomeric mono-oxygenation products of pterostilbene.
3.4.3. Identification of Pinostilbene Metabolites (M19, M28, M31, M39–M40, and M67)
Sharing the same stilbenoid core structure as pterostilbene, pinostilbene is a demethylated derivative of pterostilbene. In addition, a pinostilbene monoglucuronide conjugate (M + 176) had been previously found as a urinary metabolite in mice after oral gavage of pterostilbene.19 Therefore, we selected pinostilbene as a byproduct center to search all the possible pinostilbene metabolites.
In the positive ion mode, with retention times of 7.14 and 9.36 min, M31 and M67 were eluted. They were 14 Da less than M0, so they were predicted as demethylation products of pinostilbene. The loss of 18 Da (m/z 243 → m/z 225) was observed in the ESI-MS2 spectra. The DPIs at m/z 137 and m/z 121 also explained that they were demethylation products of pterostilbene. Similarly, M40 was 14 Da less than M0 in the negative ion mode. The fragments at m/z 241, m/z 225 ([M – H–O]−), and m/z 197 ([C13H10O2–H]−) were detected in its ESI-MS2 spectra. Thus, M31, M40, and M67 were pinostilbene and its isomers.
M19, M28, and M39 were eluted at 6.23, 6.85, and 7.63 min, respectively. All of them possessed the experimental [M – H]− ions at m/z 417.11913 (C21H21O9, mass error within 5 ppm). By comparing to pinostilbene, a neutral loss of 176 Da presumed that they might combine with GluA. They all produced DPIs at m/z 417, m/z 241 ([M – H–GluA–CH2]−), and m/z 175 ([C6H8O6–H]−) in the ESI-MS2 spectrum. Hence, M19, M28, and M39 were tentatively judged as glucuronidation products of pinostilbene or its isomers.
3.4.4. Identification of Organic Acid Metabolites (M34, M50, M69, and M80)
The organic acid metabolite generation was due to the methoxy which underwent hydroxylation to form ketones. As one methoxy produced a metabolic reaction as above, the product ions m/z 242 ([M + H–CO]+), m/z 212 ([M + H–CO–OCH3]+), and m/z 196 ([M + H–CO–OCH3–O]+) could be used as DPIs to implement the rapid structural identification of the metabolites of organic acids as a new byproduct center.
M34 generated the [M + H]+ ion at m/z 285.07516 (C16H13O5, −2.070 ppm) with a retention time of 7.32 min. It is 28 Da more than M0, indicating that it might be the dual methylene ketogenic product. In its ESI-MS2 spectrum, they gave rise to the fragment ions at m/z 285, m/z 197 ([M + H–2COOH]+), m/z 167 ([C8H6O4 + H]+), and m/z 121 ([C8H8O + H]+), the latter two of which are due to breakage of ethylene bond ends. It was finally deduced as a dual methylene ketogenic product of M0. By exploring the data, M2 at m/z 444.07440 (C21H18O8NS, −0.819 ppm) was found, which was 161 Da more than M34. From Table 1 and the identification process of M23, it can be observed that M2 was a binding product of M34 and NAC. Besides M2, there might also be the metabolic process of NAC binding to carboxyl groups to form esters. M77 was eluted at 10.20 min and afforded the [M – H]− ion at m/z 428.08041 (C21H18O7NS, 1.310 ppm) in negative ion mode. It is only 16 Da more than M2, and the losses of 80 Da (428 → 348) and 81 Da (348 → 267) were observed in its ESI-MS2 spectra, reflecting the presence of NAC from the side. Thus, M77 was also a binding product of M34 and NAC. According to the identification process of glucuronidation products, M3 was tentatively identified as a glucuronidation product of M34. M7 afforded the [M + H]+ ion at m/z 447.12759 (C22H23O10, −2.199 ppm) in positive ion mode. In the ESI-MS2 spectrum, it produced the base peak ion at m/z 285 by the loss of glucosyl (162 Da) and the DPIs at m/z 253 ([M + H–162–2O]+) and m/z 225 ([M + H–162–2O–CO]+). M17 with the [M – H]− ion at m/z 363.01837 (C16H11O8S, 4.010 ppm) was observed at 5.97 min. In its ESI-MS2 spectrum, it gave rise to the base peak ion at m/z 283 by the loss of SO3 (80 Da) and the DPIs at m/z 363 and m/z 80. M17 was tentatively identified as a sulfonation product of M34.
M50 and M69 were eluted at 8.77 and 9.77 min, respectively, with the same formula C16H15O4 (m/z 271.09601 and m/z 271.09610, mass error within 5 ppm) in positive ion mode. They were 14 Da more massive than M0, and thus, they preliminarily deduced the existence of hydroxylation and dehydrogenation. In the ESI-MS2 spectra, they produced ions such as at m/z 243 ([M + H–CO]+) and m/z 228 ([M + H–COO]+), which provided evidence for identifying a carboxyl group. In addition, M80 was in the negative ion mode as well. In the end, M50, M69, and M80 were identified as methylene ketogenic products or their isomers.
Based on the identification results of M50, M1 was 192 Da (2SO4) more than M80. The fragment ions at m/z 81(SO3H) and m/z 80 (SO3) provided evidence for identifying a sulfonate group. M1 was tentatively identified as a double sulfonation and oxygenation product of M80. M18 was 32 Da (2O) more than M50, and the base peak ions were observed at m/z 303. The fragment ion at m/z 256 was due to the loss of 2O. It was identified as a double oxygenation product of M50. The metabolite M10 was produced by the breakage of the ethylene bond of M80.
M25 showed its [M – H]− ion at m/z 287.09268 (C16H15O5) with a mass error of 4.458 ppm. On account of the neutral loss of O and CH2O, the fragment ions at m/z 271 and m/z 257 were generated in its ESI-MS2 spectrum, respectively, suggesting the presence of hydration. M25 was eventually identified as a methylene ketogenic and hydration product of M0. M33 with the [M – H]− ion at m/z 445.11478 (C22H21O10, 4.171 ppm) was observed at 7.26 min in the negative ion mode. Comparing the molecular formula with that of M80, it was presumed that they might combine with GluA. In the MS2 spectra, the DPIs at m/z 445, m/z 269 ([M – H–GluA]−), and m/z 175 all indicated that M33 was a glucuronidation product of M80.
With a retention time of 7.48 min, M37 was eluted in the positive ion mode. It was 30 Da (CH2O) more than M50. In the ESI-MS2 spectra, it produced ions at m/z 301, m/z 270 ([M + H–OCH3]+), and m/z 241 ([M + H–OCH3–OCH2]+). Thus, this compound was tentatively identified as an oxidation and methylation product of M50. Additionally, M44 was 57 Da more than M50 and presented the [M + H]+ ion at m/z 328.11835 (C18H18O5N, 3.634 ppm), with a retention time of 8.01 min. The DPIs at m/z 328 and m/z 57 owing to the neutral loss of C16H15O4 provided adequate evidence for metabolite identification. Hence, we deemed that M44 was the binding product of glycine (Gly) and M50.
M61 and M64 eluted at 9.25 and 9.28 min in the urine and plasma, respectively, and were 146 Da more massive than M50 in positive ion mode. In the ESI-MS2 spectra, it produced ions at m/z 433, m/z 269 ([M + H–C6H10O5]+), and m/z 225 ([M + H–C6H10O5–CO2H]+) with the loss of the glucose moiety. Based on the preliminary judgments of the addition and subtraction of characteristic fragments such as m/z 121 and m/z 137, M61 and M64 were speculated to be binding products of M12 and Glc. M68 with experimental [M + H]+ ions at m/z 269.08002 (C16H13O4, −3.030 ppm) was observed at 9.72 min. It was 2 Da less massive than M50, indicating that they might be a dehydrogenation product of M50. It yielded ESI-MS2 base peak ions at m/z 269 and DPIs at m/z 255 ([M + H–CH2]+), m/z 226 ([M + H–CH3–CO]+), and m/z 137 ([C8H8O2 + H]+). To sum up, M68 was characterized as a methylene ketogenic and dehydrogenation product of M0.
3.5. Comparative Analysis of Pterostilbene Metabolites In Vivo and In Vitro
Drug metabolism played a crucial part in the research of pharmacological mechanisms, development of new drugs, and clinical use. In this work, the metabolism in vivo (plasma, liver, urine, and feces) and in vitro (rat liver microsomes) was investigated. A total of 77 metabolites in vivo and 15 metabolites in vitro were found. Moreover, 12 metabolites were only detected in vitro and 3 metabolites in vitro were also found in vivo.
For in vivo, 50 and 38 metabolites were observed in rat plasma and urine, respectively, which inferred that plasma and urine possessed high activity for pterostilbene metabolism in vivo, while only 4 and 12 metabolites were detected in rat feces and liver, respectively, which implied that rat feces and liver might hold low biotransformation activity. Liver metabolism often determines the overall clearance rates of many pharmaceuticals.20 In this research, the reactions of hepatic metabolites were demethylation, glucuronidation, hydroxylation, and sulfation.20 Liver microsomes are vesicles formed from the endoplasmic reticulum when liver cells are lysed, which contain phase I enzymes. The results of this study also show that hydroxylation and demethylation are the main metabolic processes in vitro.
In many cases, assessing whether a compound administered to rats results in changes of the liver of the animal to metabolize drugs is done using in vivo measurements of the liver tissue as well as in vitro measurements of hepatic microsomes. In vitro microsomal metabolic assays are rapid and simple, allowing direct observation of enzyme–substrate interactions, reducing the interference of many in vivo factors and having good stability of the metabolized sample.21 Metabolic stability is one of the most important ADME properties of drug candidates, which might affect clearance, half-life, and oral bioavailability.22 Therefore, in vitro metabolism might be a beneficial adjunct to in vivo metabolism in this research.
In the same way, the structural identifications of other compounds are shown in the attachment (Appendix A).
3.6. Comparative Analysis of Pterostilbene Metabolites in Plasma Treated with Different Methods
In this study, a total of 50 metabolites were detected in rat plasma, which were prepared by three methods. Among them, 41 metabolic products were obtained by SPE (method I), and 9 and 10 metabolites were screened by acetonitrile precipitation (method II) and methanol precipitation (method III), respectively, which are shown in Figure 4.
Figure 4.

Venn analysis chart of metabolites by three biological treatment methods.
The metabolic pathways which are common to all three processing methods are methylene ketogenic, glucuronidation, and their compound reactions (M4 and M68). Method I and method II share possession of methylene ketogenic, glucuronidation, hydroxylation, dehydrogenation, and their compound reactions (M4, M10, M12, M21, M34, and M68). In addition, method II and method III share possession of sulfated, methylene ketogenic, and dehydrogenation metabolites (M12, M68, and M78). Method I and method III share methylene ketogenic and glucuronidation metabolites (M4 and M68).
The presence of complex plasma components such as lipids and salts also increases the challenge of sensitivity, resolution, and reproducibility of the instrument.23 Such “preprocessing” of plasma samples is critical in metabolic analysis based on mass spectrometry. Currently, organic solvent precipitation is the most common method used for plasma sample pretreatment in drug metabolism studies, with methanol or acetonitrile being used as the protein precipitant.24 However, the results above revealed that the majority of the metabolites were obtained by method I after the same detection analysis. It showed that the SPE cartridge was the most suitable method with the functions of enrichment and purification. The Oasis HLB is a reversed-phase polymeric sorbent, which can provide a method for desalting test solutions, high analyte recoveries, and effective depletion of interfering compounds.25 Furthermore, metabolites afforded by methanol precipitation were slightly more abundant than that of acetonitrile precipitation, which indicated that methanol might be more adaptive for pterostilbene as a precipitation solvent than acetonitrile. These differences in metabolite quantity might be due to the different separation selectivities of organic solvents, cleaner extracts, or matrix effects, which lead to signal peaks with diverse intensity and quantity concerning pterostilbene metabolites after UHPLC-HRMS detection.
3.7. Possible Biotransformation Pathways of Pterostilbene
Enzymatic drug metabolism processes are broadly divided into two reaction categories: functionalization (or phase I) and conjugation (or phase II). It is worth mentioning that the chemical structures of the ingested compounds’ themselves could influence the rate and extent of absorption, metabolism, and excretion. Based on the chemical structure, pterostilbene could be predicted to possess better metabolic stability as it only has one hydroxyl group.26 The dimethylether structure could enhance its lipophilicity and hence increase membrane permeability. A previous metabolism study of pterostilbene revealed that phase I metabolites (hydroxylation and demethylation) and phase II metabolites (glucuronidation and sulfation) were the major metabolic routes.27 Phase II metabolism and its complicated reactions occupied the main status of these reactions. Eighty eight metabolites were successfully identified and structurally characterized including 37 phase-I and 51 phase-II metabolites. In this study, besides above metabolic reactions, pterostilbene mainly underwent glucosylation, dehydrogenation, hydrogenation, NAC binding, methylene ketogenic, acetylation, and their composite reactions in vivo. The metabolic pathway is shown in Figure 5. Unlike in vivo metabolism, in vitro metabolism is relatively simple, with only hydroxylation and demethylation. It is also worth noting that the parent drug was only monitored in vitro. This might indicate that the degradation of pterostilbene was NADPH-independent; however, the rat of in vivo metabolism may contain numerous enzymes that facilitate pterostilbene metabolism.
Figure 5.

Possible biotransformation pathways of pterostilbene.
4. Conclusions
In this study, three methods of biological sample preparation were applied to analyze the in vivo metabolism of pterostilbene in rats’ plasma. It is noted that the SPE cartridge could remove matrix effect better. A total of 88 pterostilbene metabolites were detected and identified by the UHPLC-HRMS method. Among them, 38 metabolites were found in rat urine, 50 metabolites were detected in rat plasma, 4 metabolites were characterized from rat feces, 12 metabolites were discovered in the rat liver, and 15 metabolites were found in rat liver microsomes. Obviously, most metabolites were detected in rat plasma and urine, suggesting that most metabolites could be created by plasma and excreted by urine. In addition, after careful examination, resveratrol and pinostilbene were detectable following dosing with pterostilbene. Therefore, pterostilbene might appear to act as a prodrug for resveratrol and pinostilbene.
Because optical isomers may behave different in activities, toxicology, or degradations, the identification of some isomers is still a challenge, which needs to pay more attention in the following research. Notably, during the stages of the drug development, the metabolism of thousands of compounds is evaluated as part of screening efforts and requisite follow-up studies. In a word, the different pterostilbene metabolites identified in this study may also have physiologic effects that are significantly different from those of pterostilbene and supplied useful data for further research on pterostilbene.
Acknowledgments
The work had been financially supported by Shandong Province Chinese Herbal Medicine and Decoction Piece Standard Research Topic (2020-201), Binzhou Medical University Scientific Research Fund for High-level Talents (BY2018KYQD11, 2019KYQD05, and 2019KYQD06), Young and Creative Team for Talent Introduction of Shandong Province (10073004), Youth Project of Shandong Provincial Natural Fund (ZR2021QH009), Medical and Health Technology Development Plan at Shandong Province (202006031281), and The Project of Shandong Provincial Natural Fund (ZR2020MH372).
Supporting Information Available
The Supporting Information is available free of charge at https://pubs.acs.org/doi/10.1021/acsomega.2c03924.
The structural identifications of other metabolites (Appendix A) (PDF)
Author Contributions
J.Z., S.W., and L.D. developed the idea and designed the research. P.D., H.W., J.X., Y.L., Y.C., H.L., and H.L. performed the experiments. H.W. wrote the draft of the manuscript. S.W. and J.X. contributed to revision of the manuscript. All authors read and approved the submitted version. H.W. and J.X. have contributed equally to this work.
The authors declare no competing financial interest.
Supplementary Material
References
- Trepiana J.; Krisa S.; Portillo M. P. Activity of Pterostilbene Metabolites against Liver Steatosis in Cultured Hepatocytes. Molecules 2020, 25, 5444. 10.3390/molecules25225444. [DOI] [PMC free article] [PubMed] [Google Scholar]
- Gómez-Zorita S.; Milton-Laskíbar I.; Aguirre L.; Fernández-Quintela A.; Xiao J.; Portillo M. P. Effects of Pterostilbene on Diabetes, Liver Steatosis and Serum Lipids. Curr. Med. Chem. 2021, 28, 238–252. 10.2174/0929867326666191029112626. [DOI] [PubMed] [Google Scholar]
- Zhang Y. J.; Sun H. L.; Wang T.; Liu X. X.; Liu C.; Shen F.; Wang B. Y.; Ding R. R.; Liu Y. M.; Huang G. Y.; Li W. J.; Li X. Pterostilbene Ameliorates Glycemic Control, Dyslipidemia and Liver Injury in Type 2 Diabetes Rats. Biomed. Environ. Sci. 2020, 33, 365–368. 10.3967/bes2020.049. [DOI] [PubMed] [Google Scholar]
- McCormack D.; McFadden D. A review of pterostilbene antioxidant activity and disease modification. Oxid. Med. Cell. Longevity 2013, 2013, 575482 10.1155/2013/575482. [DOI] [PMC free article] [PubMed] [Google Scholar]
- Obrador E.; Salvador-Palmer R.; Jihad-Jebbar A.; López-Blanch R.; Dellinger T. H.; Dellinger R. W.; Estrela J. M. Pterostilbene in Cancer Therapy. Antioxidants 2021, 10, 492. 10.3390/antiox10030492. [DOI] [PMC free article] [PubMed] [Google Scholar]
- Pan M. H.; Wu J. C.; Ho C. T.; Lai C. S. Antiobesity molecular mechanisms of action: Resveratrol and pterostilbene. BioFactors 2018, 44, 50–60. 10.1002/biof.1409. [DOI] [PubMed] [Google Scholar]
- Nagao K.; Jinnouchi T.; Kai S.; Yanagita T. Pterostilbene, a dimethylated analog of resveratrol, promotes energy metabolism in obese rats. J. Nutr. Biochem. 2017, 43, 151–155. 10.1016/j.jnutbio.2017.02.009. [DOI] [PubMed] [Google Scholar]
- Shikov A. N.; Flisyuk E. V.; Obluchinskaya E. D.; Pozharitskaya O. N. Pharmacokinetics of marine-derived drugs. Mar. Drugs 2020, 18, 557. 10.3390/md18110557. [DOI] [PMC free article] [PubMed] [Google Scholar]
- Kapetanovic I. M.; Muzzio M.; Huang Z.; Thompson T. N.; McCormick D. L. Pharmacokinetics, oral bioavailability, and metabolic profile of resveratrol and its dimethylether analog, pterostilbene, in rats. Cancer Chemother. Pharmacol. 2011, 68, 593–601. 10.1007/s00280-010-1525-4. [DOI] [PMC free article] [PubMed] [Google Scholar]
- Das A.; Srinivasan M.; Ghosh T. S.; Mande S. S. Xenobiotic metabolism and gut microbiomes. PLoS One 2016, 11, e0163099 10.1371/journal.pone.0163099. [DOI] [PMC free article] [PubMed] [Google Scholar]
- Jiang X.; Zhou L.; Zuo L.; Wang X.; Shi Y.; Du X.; Zhang J.; Liu L.; Li Z.; Xue L.; Liu X.; Sun Z. Pharmacokinetics and metabolism research of Shenkang injection in rats based on UHPLC-MS/MS and UHPLC-Q-Orbitrap HRMS. Drug Des., Dev. Ther. 2020, 14, 1837–1850. 10.2147/DDDT.S235646. [DOI] [PMC free article] [PubMed] [Google Scholar]
- Gawlik M.; Savic V.; Jovanovic M.; Skibiński R. Mimicking of phase I metabolism reactions of molindone by HLM and photocatalytic methods with the use of UHPLC-MS/MS. Molecules 2020, 25, 1367. 10.3390/molecules25061367. [DOI] [PMC free article] [PubMed] [Google Scholar]
- Xiao Y.; Wang Y. K.; Xiao X. R.; Zhao Q.; Huang J. F.; Zhu W. F.; Li F. Metabolic profiling of coumarins by the combination of UPLC-MS-based metabolomics and multiple mass defect filter. Xenobiotica 2020, 50, 1076–1089. 10.1080/00498254.2020.1744047. [DOI] [PubMed] [Google Scholar]
- Zhang J. Y.; Wang Z. J.; Zhang Q.; Wang F.; Ma Q.; Lin Z. Z.; Lu J. Q.; Qiao Y. J. Rapid screening and identification of target constituents using full scan-parent ions list-dynamic exclusion acquisition coupled to diagnostic product ions analysis on a hybrid LTQ-Orbitrap mass spectrometer. Talanta 2014, 124, 111–122. 10.1016/j.talanta.2013.11.025. [DOI] [PubMed] [Google Scholar]
- McMullin D. R.; Hoogstra S.; McDonald K. P.; Sumarah M. W.; Renaud J. B. Natural product discovery with LC-MS/MS diagnostic fragmentation filtering: application for microcystin analysis. J. Visualized Exp. 2019, 147, 59712. 10.3791/59712. [DOI] [PubMed] [Google Scholar]
- Huang M.; Cheng Z.; Wang L.; Feng Y.; Huang J.; Du Z.; Jiang H. A targeted strategy to identify untargeted metabolites from in vitro to in vivo: Rapid and sensitive metabolites profiling of licorice in rats using ultra-high performance liquid chromatography coupled with triple quadrupole-linear ion trap mass spectrometry. J. Chromatogr. B: Anal. Technol. Biomed. Life Sci. 2018, 1092, 40–50. 10.1016/j.jchromb.2018.05.044. [DOI] [PubMed] [Google Scholar]
- Wang Y.; Mei X.; Liu Z.; Li J.; Zhang X.; Wang S.; Geng Z.; Dai L.; Zhang J. Chemical constituent profiling of paecilomyces cicadae liq id fermentation for Astragli Radix. Molecules 2019, 24, 2948. 10.3390/molecules24162948. [DOI] [PMC free article] [PubMed] [Google Scholar]
- Liu Z. H.; Wang S. P.; Dong F.; Lin Y.; Li H. R.; Shi L.; Wang Z. B.; Zhang J. Y. Comprehensive analysis of resveratrol metabolites in rats using ultra high performances liquid chromatography coupled with high resolution mass spectrometry. Arabian J. Chem. 2020, 13, 7055–7065. 10.1016/j.arabjc.2020.07.011. [DOI] [Google Scholar]
- Sun Y.; Wu X.; Cai X.; Song M.; Zheng J.; Pan C.; Qiu P.; Zhang L.; Zhou S.; Tang Z.; Xiao H. Identification of pinostilbene as a major colonic metabolite of pterostilbene and its inhibitory effects on colon cancer cells. Mol. Nutr. Food Res. 2016, 60, 1924–1932. 10.1002/mnfr.201500989. [DOI] [PubMed] [Google Scholar]
- Shao X.; Chen X.; Badmaev V.; Ho C. T.; Sang S. Structural identification of mouse urinary metabolites of pterostilbene using liquid chromatography/tandem mass spectrometry. Rapid Commun. Mass Spectrom. 2010, 24, 1770–1778. 10.1002/rcm.4579. [DOI] [PubMed] [Google Scholar]
- Obach R. S. Predicting clearance in humans from in vitro data. Curr. Top. Med. Chem. 2011, 11, 334–339. 10.2174/156802611794480873. [DOI] [PubMed] [Google Scholar]
- Lin W. S.; Leland J. V.; Ho C. T.; Pan M. H. Occurrence, bioavailability, anti-inflammatory, and anticancer effects of pterostilbene. J. Agric. Food Chem. 2020, 68, 12788–12799. 10.1021/acs.jafc.9b07860. [DOI] [PubMed] [Google Scholar]
- Underhill G. H.; Khetani S. R. Advances in engineered human liver platforms for drug metabolism studies. Drug Metab. Dispos. 2018, 46, 1626–1637. 10.1124/dmd.118.083295. [DOI] [PMC free article] [PubMed] [Google Scholar]
- Gika H. G.; Zisi C.; Theodoridis G.; Wilson I. D. Protocol for quality control in metabolic profiling of biological fluids by U(H)PLC-MS. J. Chromatogr. B: Anal. Technol. Biomed. Life Sci. 2016, 1008, 15–25. 10.1016/j.jchromb.2015.10.045. [DOI] [PubMed] [Google Scholar]
- Nuckowski Ł.; Kaczmarkiewicz A.; Studzińska S. Development of SPE method for the extraction of phosphorothioate oligonucleotides from serum samples. Bioanalysis 2018, 10, 1667–1677. 10.4155/bio-2018-0166. [DOI] [PubMed] [Google Scholar]
- Wang P.; Sang S. Metabolism and pharmacokinetics of resveratrol and pterostilbene. Biofactors 2018, 44, 16–25. 10.1002/biof.1410. [DOI] [PubMed] [Google Scholar]
- Pietrowska M.; Wlosowicz A.; Gawin M.; Widlak P. MS-based proteomic analysis of serum and plasma: problem of high abundant components and lights and shadows of albumin removal. Adv. Exp. Med. Biol. 2019, 1073, 57–76. 10.1007/978-3-030-12298-0_3. [DOI] [PubMed] [Google Scholar]
Associated Data
This section collects any data citations, data availability statements, or supplementary materials included in this article.