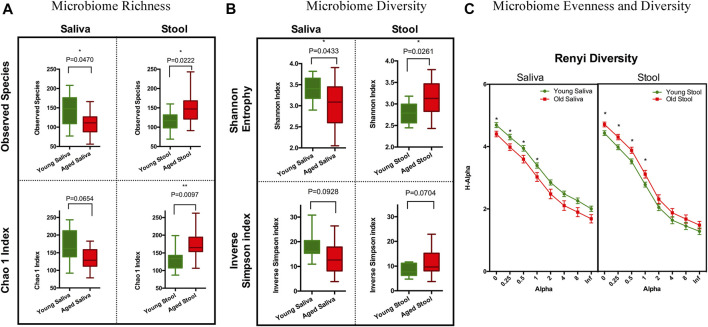
FIGURE 1.
Ecology richness and diversity of the microbiome. (A) Microbiome richness plot of a saliva and stool sample (*p < 0.05; **p < 0.01). (B) Microbiome Shannon diversity and inverse Simpson index plot of a saliva and stool sample. (C) Renyi diversity of the microbiome in different age groups. X-axis represents the alpha-value (increased alpha-value indicates a higher weight on dominant organisms when calculating diversity); Y-axis is the diversity index calculated based on each alpha-value (*p < 0.05. t-test with Holm-Sidak correction).

