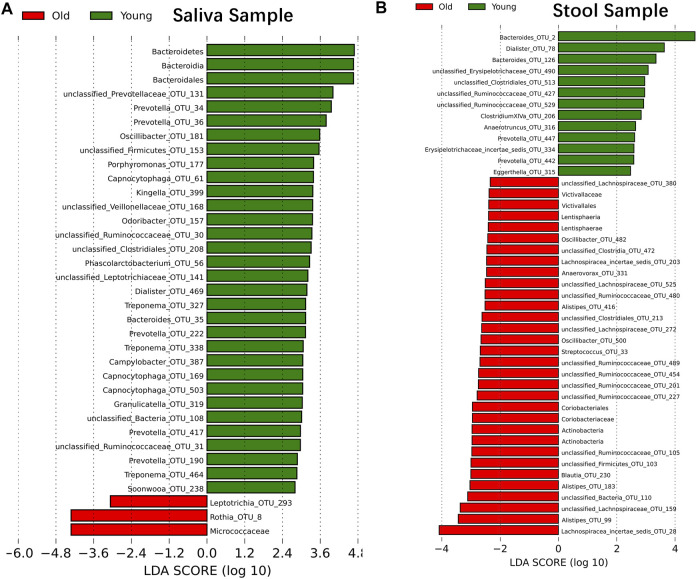
FIGURE 2.
Microbiome modulated by age. The bacteria taxonomies changed with age. Data are plotted with a linear discriminant analysis score with log10 transformation. Green bars indicate this taxonomy is more abundant in young cohorts and red bars indicate this taxonomy is more abundant in aged cohorts. (A) Saliva sample. (B) Stool sample.

