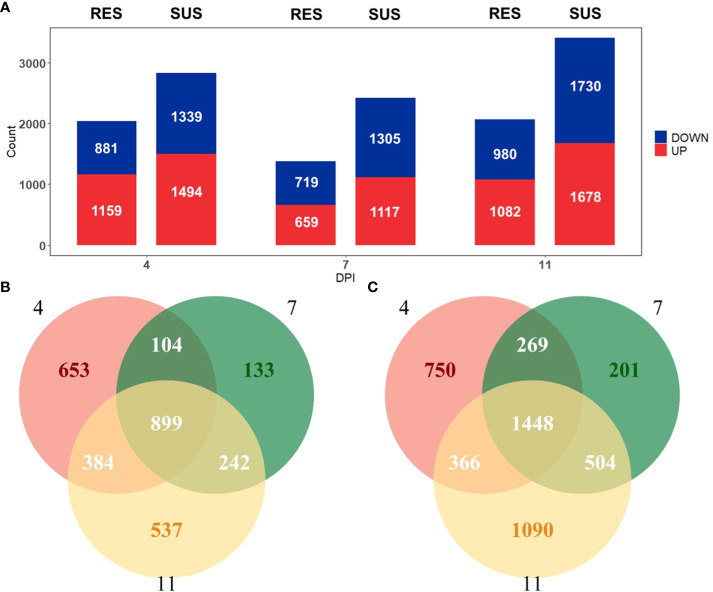
Figure 2.
(A) Number of genes differentially expressed (|log2(FoldChange)| > 1 and adjusted p-value < 0.05) relative to day 0 in resistant (left) and susceptible (right) pigs on days 4, 7 and 11 post-infection. (B) Venn diagram comparing identified DEGs in resistant pigs. (C) Venn diagram comparing identified DEGs in susceptible pigs.

