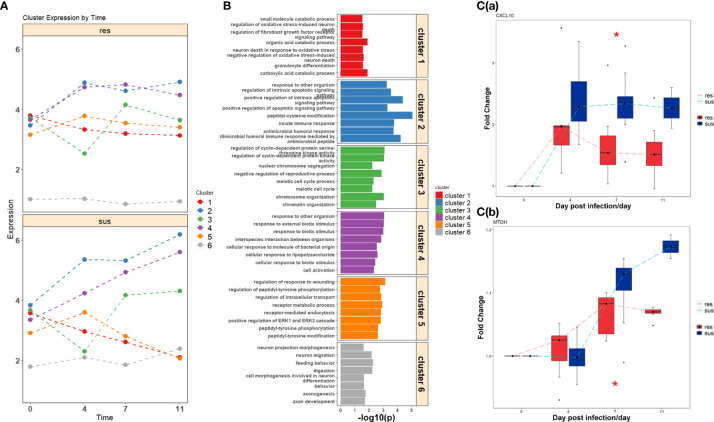
Figure 4.
(A) Temporal expression patterns of clustered DEGs in resistant (top) and susceptible (bottom) pigs post infection. (B) Gene ontology enrichment analyses of DEGs within clusters. (C) The expression values of significant DEGs related to immune response between resistant (red) and susceptible (blue) pigs; (a) CXCL10, (b) MTDH. Significance level is shown by *, p-value < 0.05.

