Figure 6.

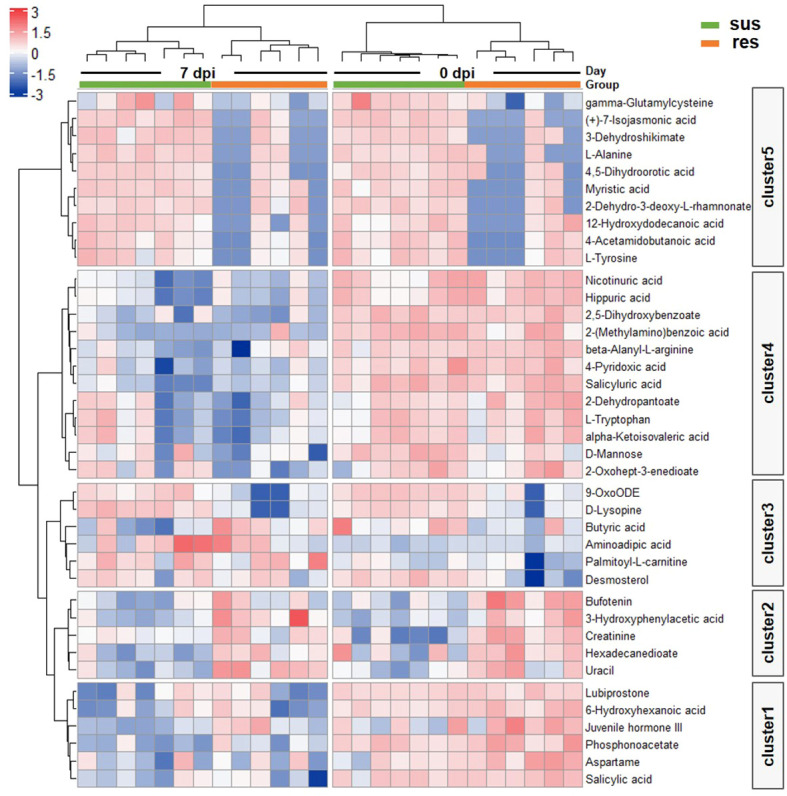
Heatmap of DE metabolites by one way ANOVA. Blue to red scale indicates negative or positive associations based on metabolites expression levels. Each column represents a sample, and each row represents a DE metabolite.

Heatmap of DE metabolites by one way ANOVA. Blue to red scale indicates negative or positive associations based on metabolites expression levels. Each column represents a sample, and each row represents a DE metabolite.