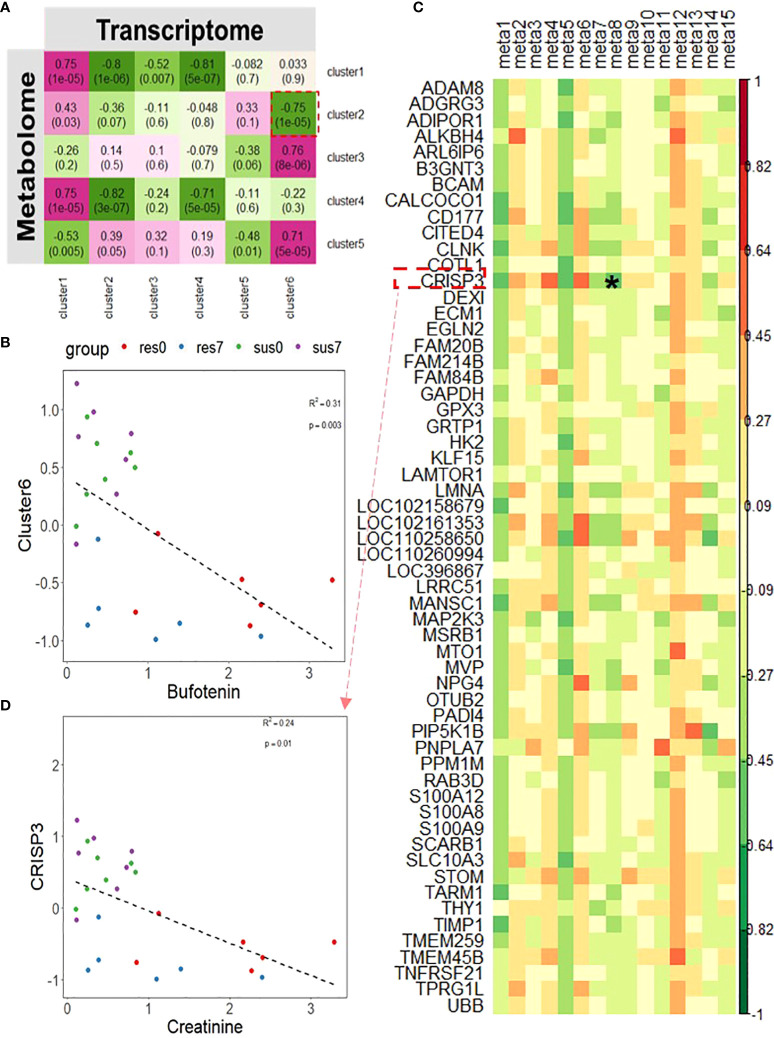
Figure 8.
(A) Correlation between transcriptomic clusters of DEGs between resistant/susceptible pigs and metabolomic clusters; The magenta to green scale color indicates a positive to negative Pearson’s coefficient value, and coefficient values and the corresponding p-values are labeled on the boxes. (B) Correlation between bufotenin and transcriptomics cluster 6. (C) Correlation between DE metabolites in metabolomics cluster 2 and 5 and DEGs in transcriptomics cluster 2; the horizontal axis represents DE metabolites, and the vertical axis represents DEGs. Candidate combination of the metabolite and gene was marked by "*". (D) Correlation between creatinine and CRISP3. meta1~meta15 respectively represent metabolites in cluster 2 and 5: Bufotenin, (+)-7-Isojasmonic acid, 12-Hydroxydodecanoic acid, Myristic acid, Hexadecanedioate, L-Alanine, Uracil, Creatinine, 4,5-Dihydroorotic acid, 2-Dehydro-3-deoxy-L-rhamnonate, 4-Acetamidobutanoic acid,3-Dehydroshikimate, gamma-Glutamylcysteine, 3-Hydroxyphenylacetic acid, L-Tyrosine.

