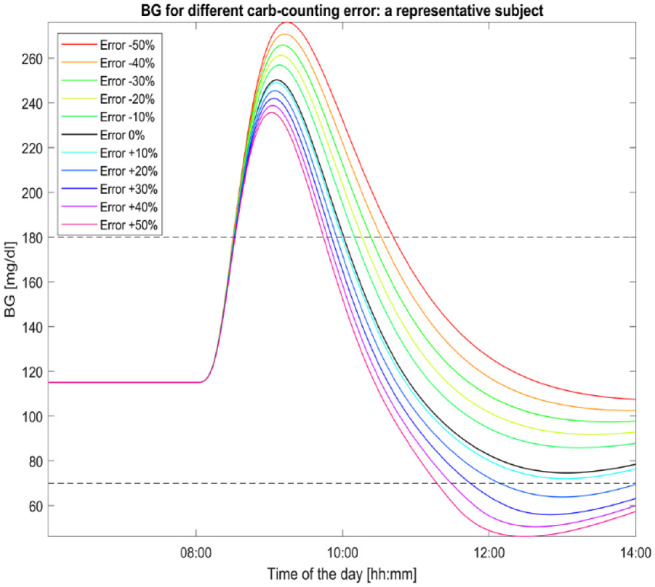
Figure 1.

Glycemic profiles of a representative subject for different carb-counting error levels. The black curve (the one with error equal to 0%) represents the subject BG excursion in absence of carb-counting error. A meal of 60grams of CHO is given to the subject at 8:00.
