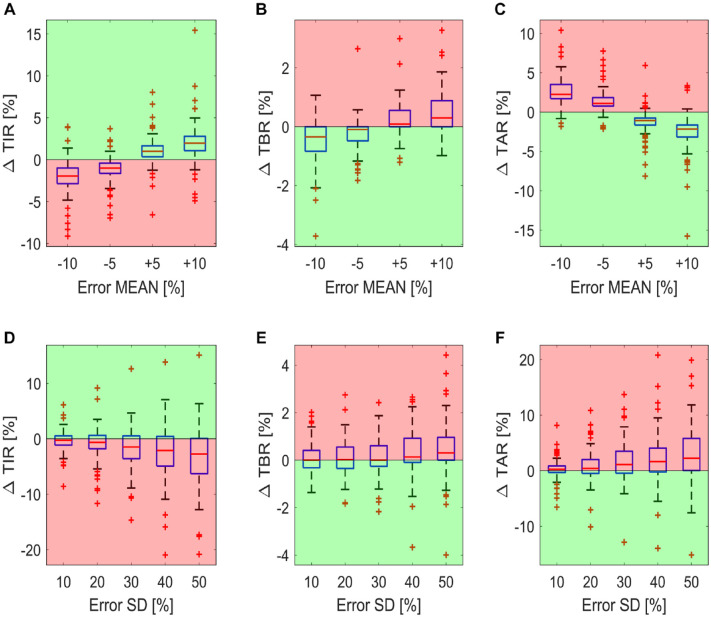
Figure 3.
Boxplot of the difference in time in ranges compared to the reference case for the 100 virtual subjects. The boxplots of the ΔTIR, ΔTAR, and ΔTBR for carb-counting error SD fixed to 0 and by varying the carb-counting error mean are reported in panels A, B and C, respectively. The boxplots of the ΔTIR, ΔTAR, and ΔTBR for carb-counting error mean fixed to 0 and by varying the carb-counting error SD are reported in panels D, E, and F, respectively. Red zones are the ones in which the metrics are worse than for the reference case, while the green zones are the ones in which the metrics are better than for the reference case.

