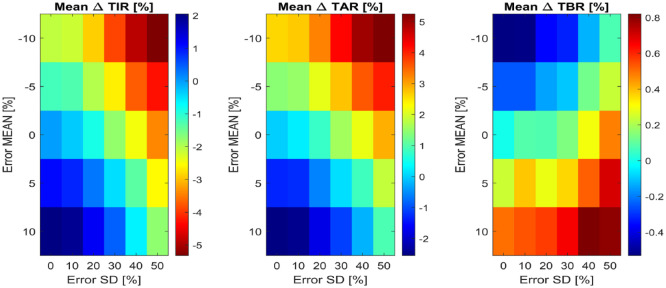
Figure 4.
Bidimensional maps of the mean among the 100 virtual subjects of ΔTIR (at left), ΔTAR (in the middle) and ΔTBR (at right), for all combinations of carb-counting error mean and SD tested. In each map, the x-axis represents error SD, while the y-axis the error mean. Each color represents a different quantitative value of the metric, reported by the legends on the right of each map.

