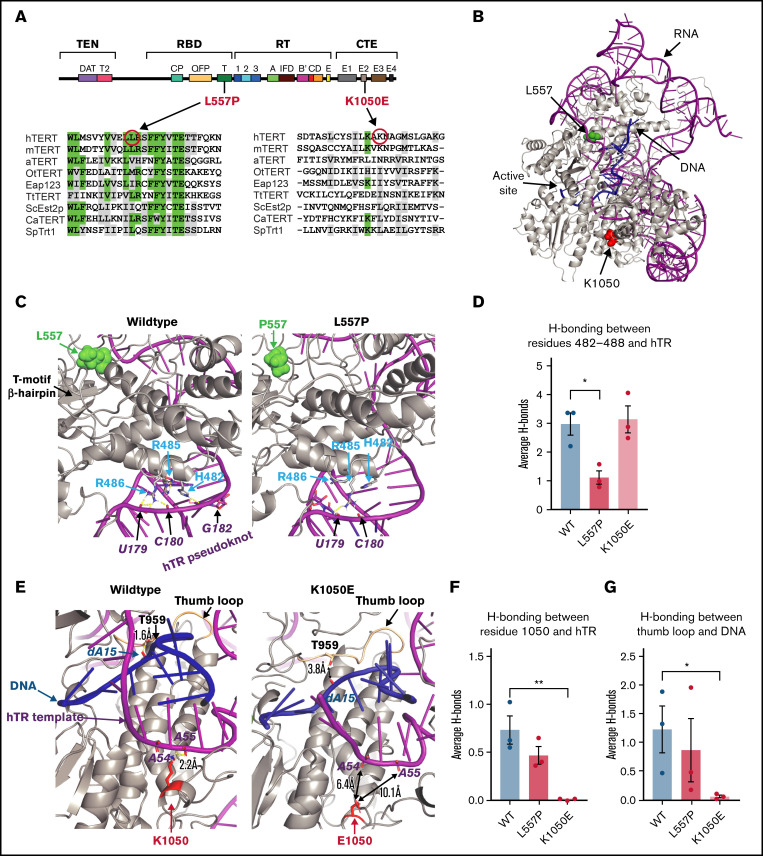
Figure 2.
Molecular modeling predicts that L557P affects hTERT binding to hTR, whereas K1050E affects DNA binding. (A) Schematic of the secondary structure of hTERT, showing the 4 major functional domains: telomerase essential N-terminal (TEN) domain, RNA binding domain (RBD), reverse transcriptase (RT) domain, and C-terminal extension (CTE) domain. The alignments82 show the degree of conservation of the regions surrounding L557P and K1050E in 9 species, including vertebrates, a plant, ciliated protozoa, and yeast: hTERT, human; mTERT, Mus musculus; aTERT, Arabidopsis thaliana; OtTERT, Oxytricha trifallax; Eap123, Euplotes aediculatus; TtTERT, Tetrahymena thermophila; ScEst2p, Saccharomyces cerevisiae; CaTERT, Candida albicans; SpTRT1p, Schizosaccharomyces pombe. Identical positions are indicated in green; positions showing amino acid similarity are highlighted in gray. (B) Model of WT hTERT used for molecular dynamics simulations. Protein, RNA, and DNA are gray, magenta, and blue, respectively. Locations of investigated mutations, L557 and K1050, are represented as space-filling atoms and colored in green and red, respectively. (C) Effect of L557P (green spheres): close-up view of the shift in position of the 482-to-488 helix relative to hTR in hTERTL557P (right) compared with WT hTERT (left). The change in hydrogen bonding between the 482-to-488 loop and hTR is quantified in panel D; data are the mean ± standard error of the mean (SEM; n = 3). *P = .0147, by 2-tailed t test. (E) Effect of K1050E: in hTERTwt (gray, left), K1050 (red) forms a hydrogen bond with hTR (magenta) at adenine-55. This hydrogen bond is lost in the hTERTK1050E protein (right) (quantified in panel F; data are the mean ± SEM [n = 3]; **P = .0074, by 2-tailed t test). In the hTERTK1050E simulation, the DNA substrate (residues 11-18) is shifted away from the thumb loop (hTERT residues 957-965; wheat) compared with WT and is accompanied by a reduction in hydrogen bonding between the thumb loop and DNA in hTERTK1050E compared with WT (quantified in panel G; data are the mean ± SEM [n = 3]; *P = .0461, by 2-tailed t test). Hydrogen bonds are yellow dashed lines (E), and the distance between a protein residue and the nearest nucleotides (outside hydrogen bonding distances) are indicated by double-headed black arrows (E; right).

