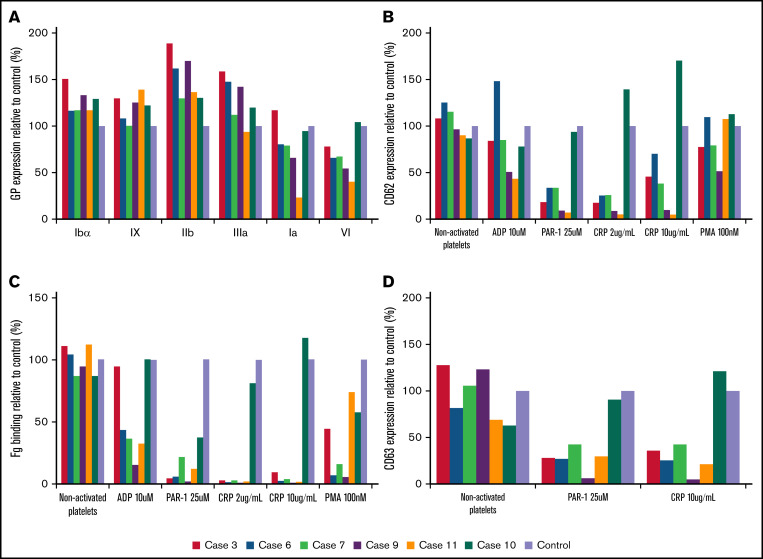
Figure 3.
Flow cytometric analysis of platelet glycoproteins, fibrinogen binding, and granule secretion. (A) Platelet glycoprotein expression of Src p.E527K carriers (cases 3, 6, 7, 9, and 11) and a control. (B) Fibrinogen-Alexa488 binding, (C) α granule secretion, and (D) δ granule secretion in resting state and upon platelet stimulation with specific agonists. The graphs show median fluorescence intensity relative to the control (100%). Fg, fibrinogen.

