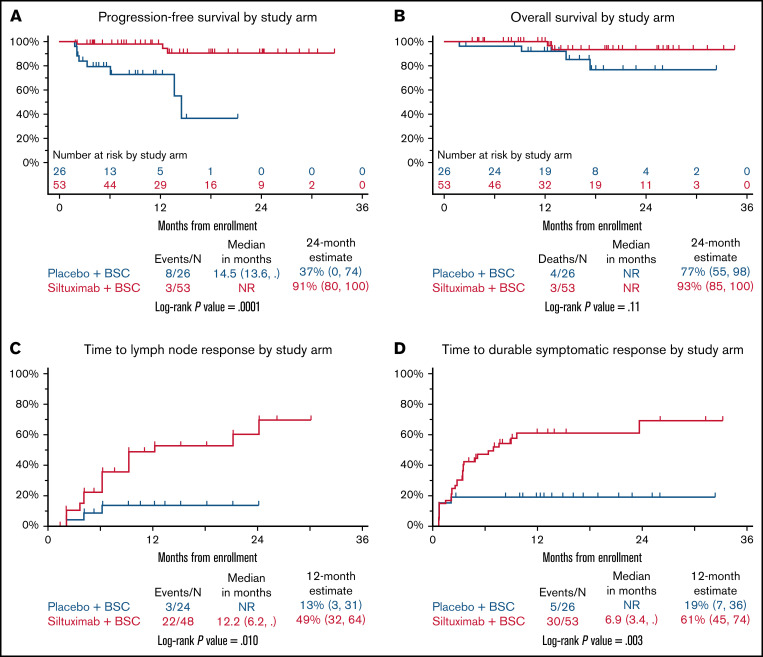
Figure 1.
Clinical and lymph node responses. Kaplan-Meier curves for PFS (A) and overall survival in patients treated with siltuximab or placebo (B). Cumulative incidence curves for time to normalization of lymph node response (C) and time to durable symptomatic response (D) in patients treated with siltuximab or placebo. BSC, best supportive care; NR, not reached.

