
Figure 3. Tuning IC intramolecular affinity modulates Treg bias.
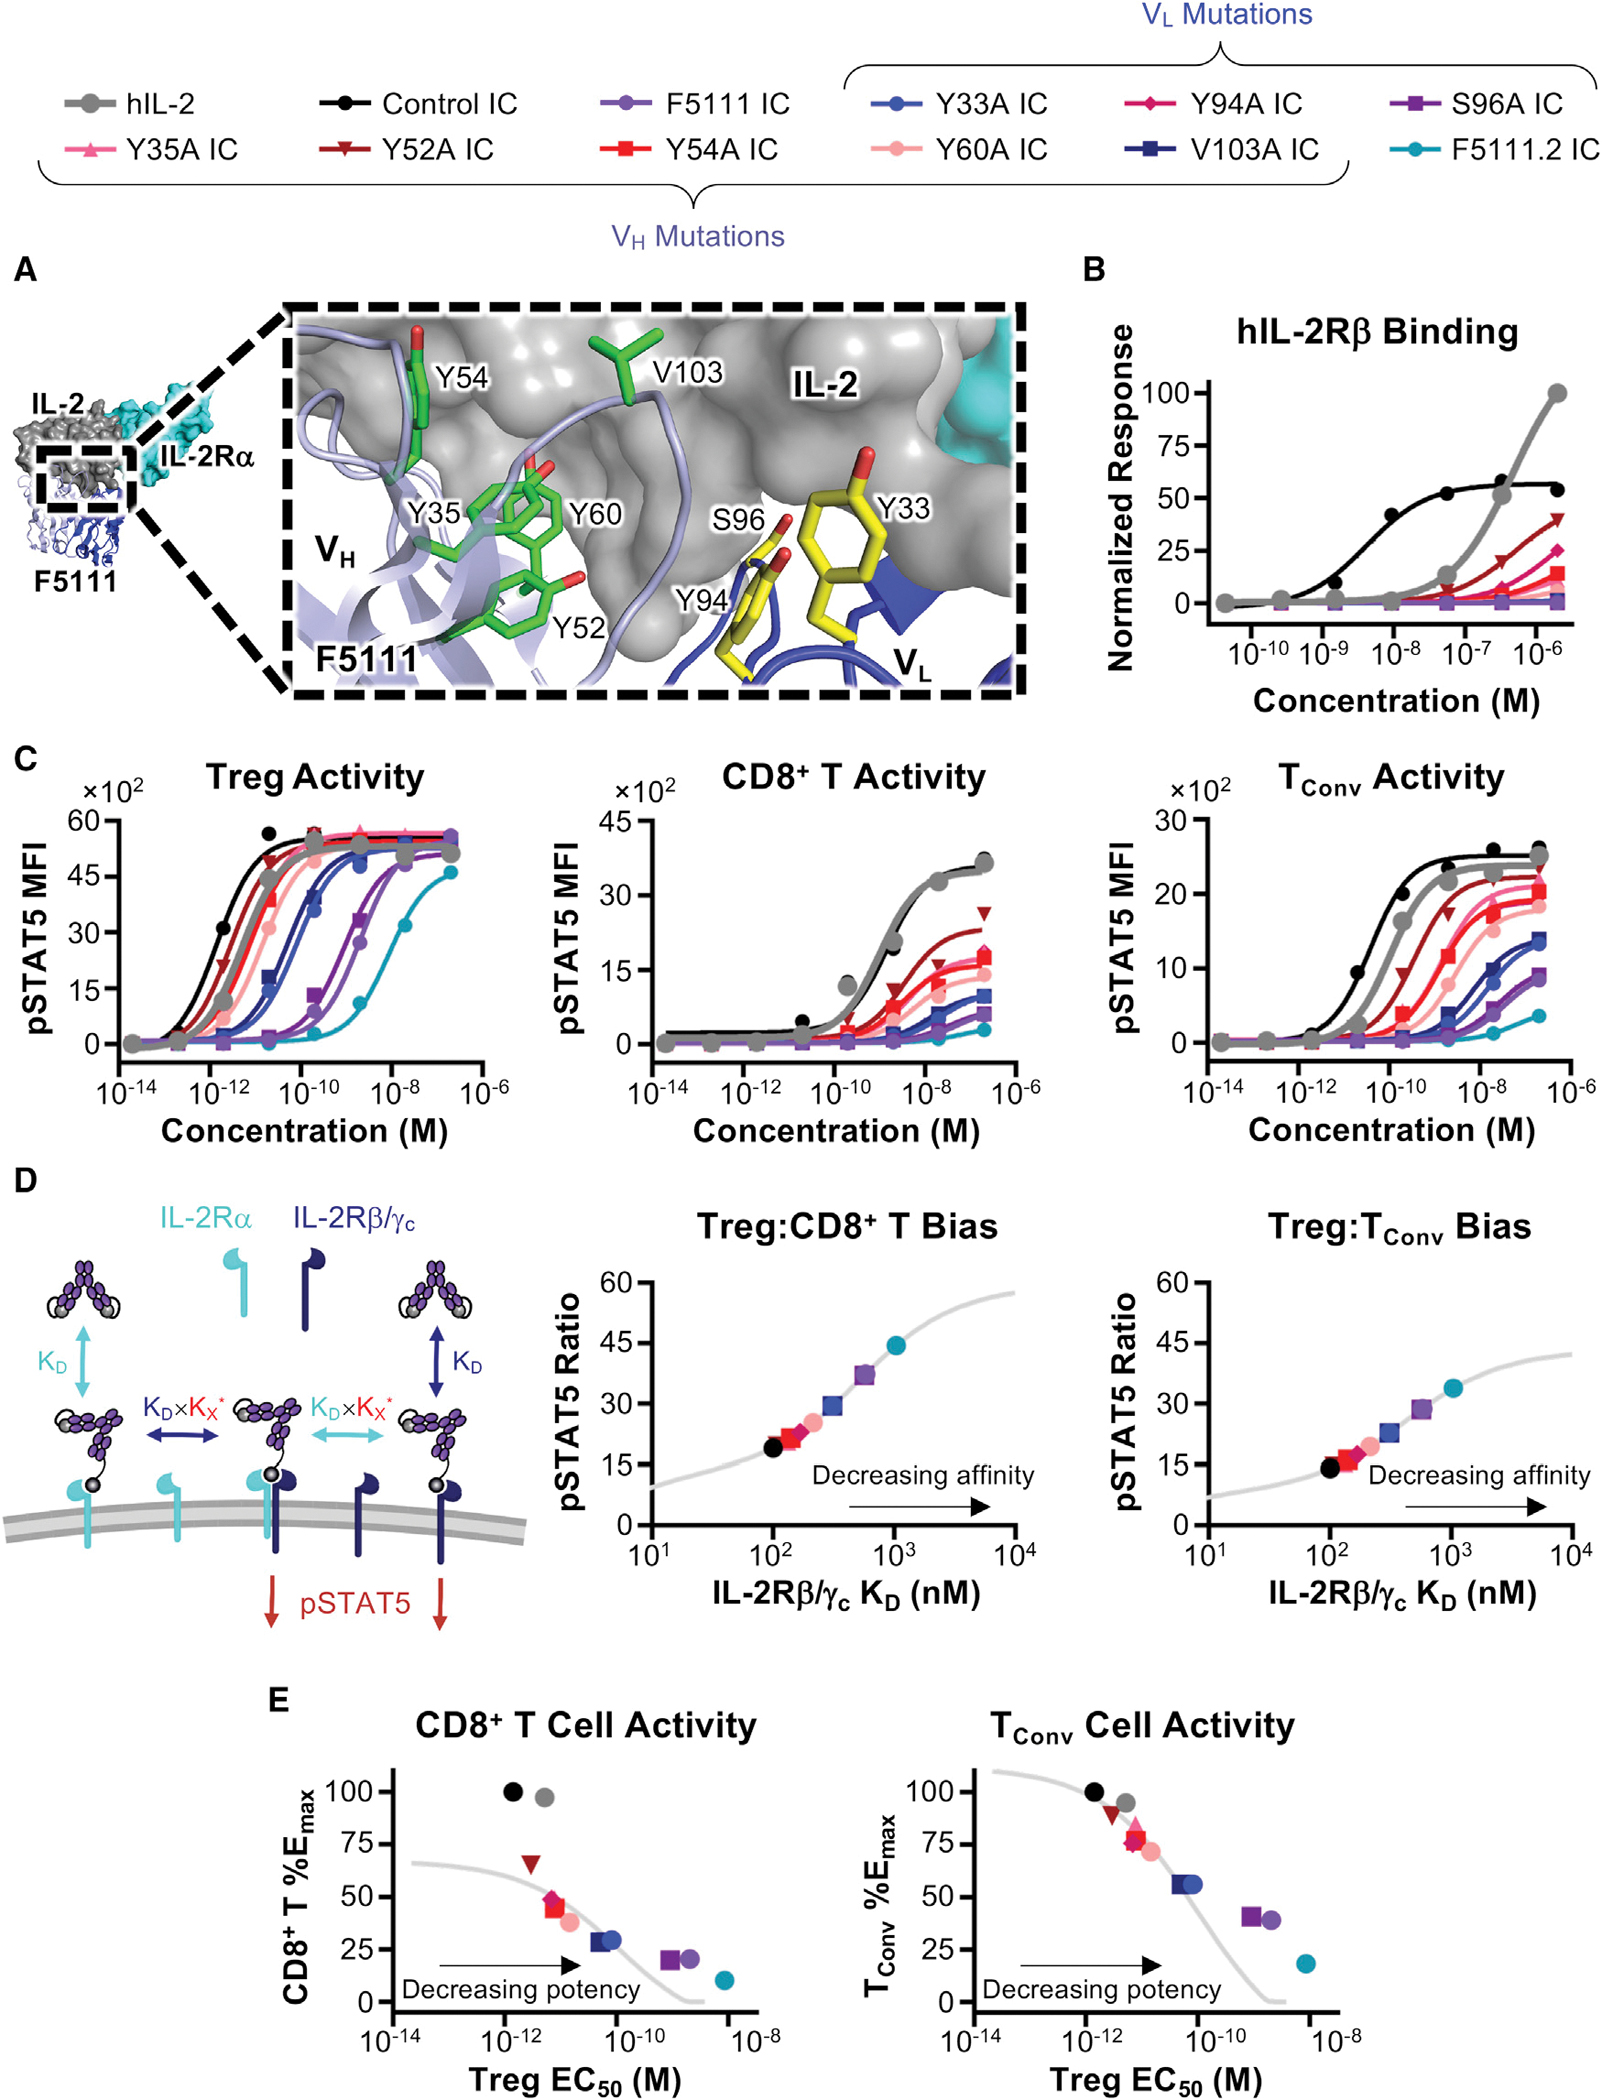
(A) hIL-2/F5111 crystal structure (PDB: 5UTZ) with alanine-mutated residues shown in yellow (LC) or green (HC). Human IL-2Rα is overlaid from the IL-2 quaternary complex structure (PDB: 2B5I).
(B) Equilibrium biolayer interferometry-based titrations against hIL-2Rβ.
(C) STAT5 phosphorylation responses of stimulated human Treg (left), CD8+ T (middle), and TConv (right) cells.
(D) Schematic of multivalent binding model (left). Predicted Treg:CD8+ T (middle) and Treg:TConv (right) pSTAT5 ratios for ICs at 10 pM concentration are plotted against predicted IL2Rβ/γc KD (nM).
(E) Predicted (lines) and experimental (points) percent control IC pSTAT5 EMax on CD8+ T (left) or TConv (right) cells plotted against the predicted (lines) or experimental (points) pSTAT5 EC50 on Tregs for each IC. See also Figure S3; Tables S2 and S4.