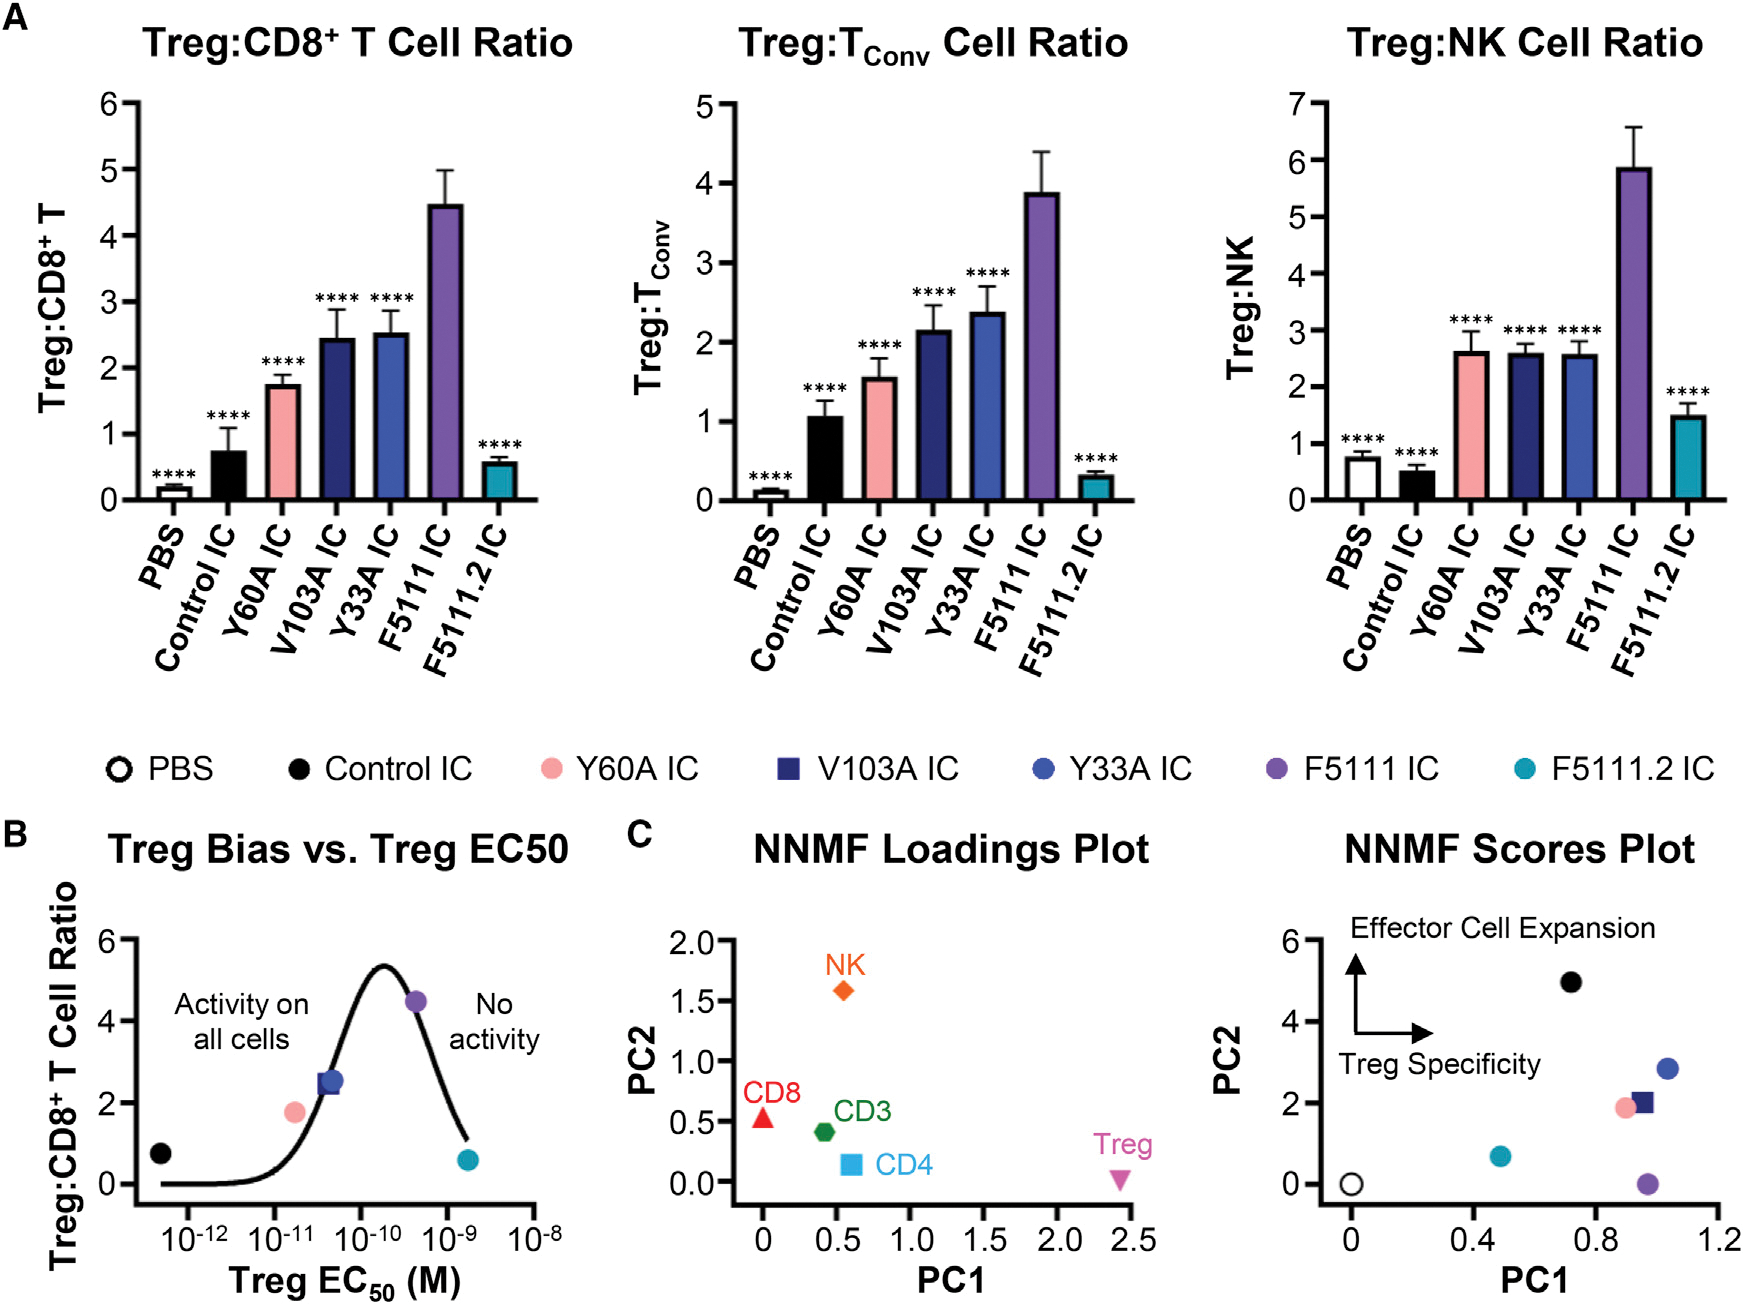
Figure 4. Parent F5111 IC induces maximum Treg expansion bias.

(A) Treg:CD8+ T (left), Treg:TConv (middle), and Treg:NK (right) cell ratios in NOD mice spleens after four daily treatments with PBS (n = 4) or 8.2 μg (1.5 μg IL-2 equivalence) control IC (n = 4), Y60A IC (n = 5), V103A IC (n = 4), Y33A IC (n = 4), F5111 IC (n = 5), or F5111.2 IC (n = 4). Data represent mean + SD. Statistical significance compared with F5111 IC is shown (all data in Table S6).
(B) Plot of Treg:CD8+ T cell in vivo expansion ratio versus pSTAT5 EC50 on human Tregs (Figure S4C, left; Table S4). Data were fit to a Gaussian distribution.
(C) Non-negative matrix factorization (NNMF) loadings plot (left) and scores plot (right) of in vivo cell subset expansion studies in NOD mice. *p ≤ 0.05, **p ≤ 0.01,</p>***p ≤ 0.001, ****p ≤ 0.0001. See also Figures S4 and S5.
