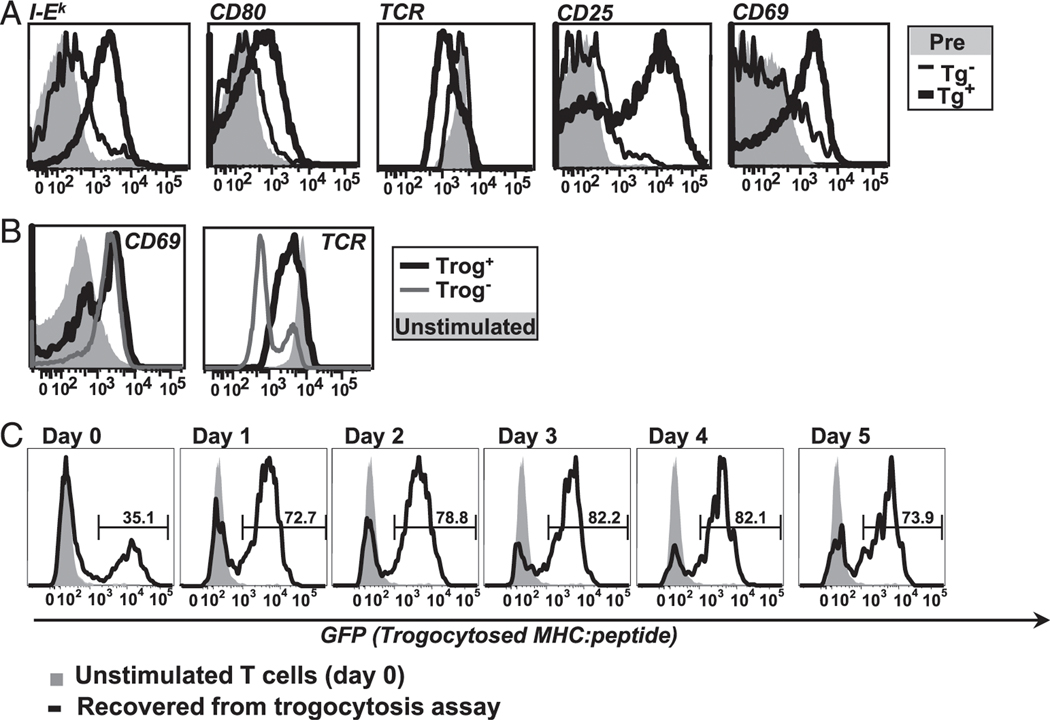
FIGURE 1.
In vitro trogocytosis mimics in vivo trogocytosis and is associated with the selective T cell survival after removal of APC. (A) In vivo trogocytosis. Histograms comparing level of trogocytosed I-Ek (far left) and CD80 (left) on recovered TCR transgenic T cells from MCC:GFP transgenic (black line) and negative littermates (thin black line) 4 d after adoptive transfer. The activation state of the recovered cells was determined by flow cytometric analysis of TCR downmodulation (center) and CD25 and CD69 (right, far right). Preinjection cells are shown for comparison (shaded histogram). Data are representative of three separate experiments (two mice per group for each experiment). (B) Both trog+ and trog− cells are activated during standard in vitro trogocytosis assay. CD69 (left) and TCR (right) expression on T cells recovered from fibroblast APC. Data are representative of six separate experiments. (C) Trog+ cells preferentially survive after removal of APC. T cells were recovered from standard trogocytosis assay and cultured at low density (104/ml). At indicated time points, the presence of trogocytosed GFP-tagged MHC on CD4+Vβ3+ gated cells was determined by flow cytometry. The level of trogocytosed MHC:peptide on day 0 unstimulated cells (gray shaded) and on recovered T cells at the indicated time point (black line) are shown. Horizontal region markers indicate the frequency of trog+ cells in the cultures. Data are representative of four separate experiments.

