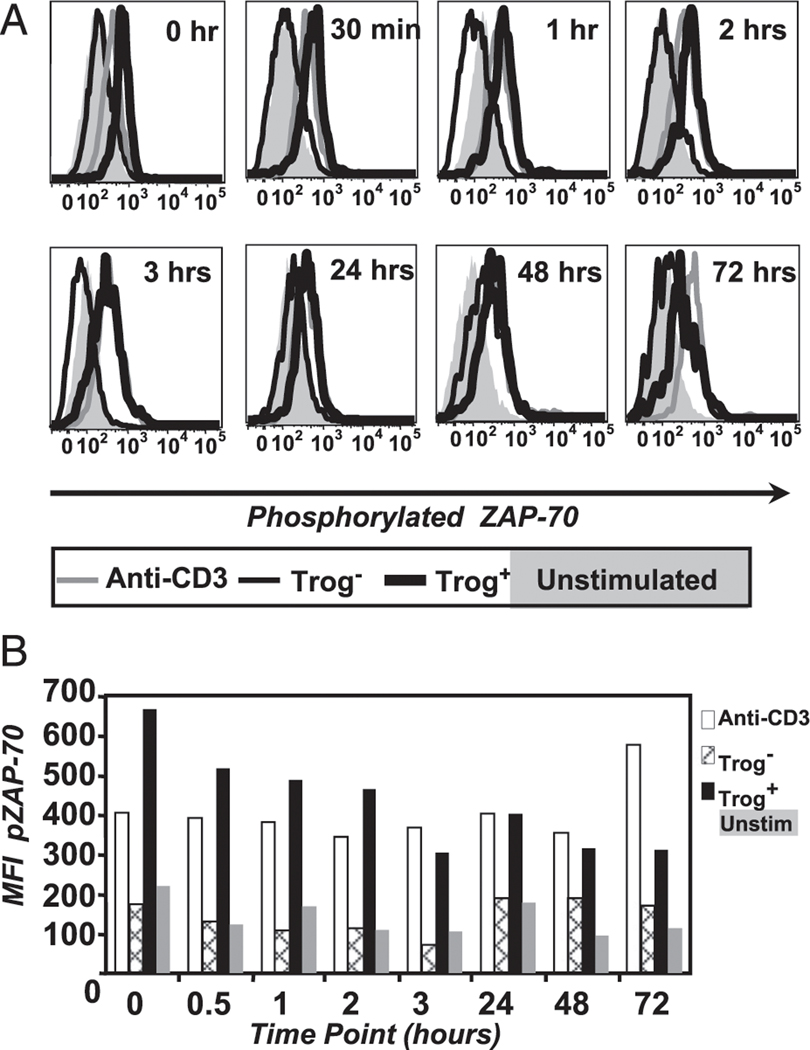
FIGURE 2.
TCR-proximal signaling is sustained in trog+CD4+ T cells. (A) T cells were recovered from the standard in vitro trogocytosis assay using MCC:FKBP APC and fixed immediately (0 h) or were cultured for the indicated times before fixation and Ab staining. The level of pZAP-70 in CD4+Vβ3+ gated trog+ (thick black line), trog− (thin black line), and unstimulated cells (shaded histogram) are shown for each time point. Cross-linked anti-CD3 (gray line) was used to stimulate TCR signaling as a positive control. (B) Mean fluorescence intensity values for the pZAP-70 flow cytometry data in (A). Data are representative of six separate experiments.

