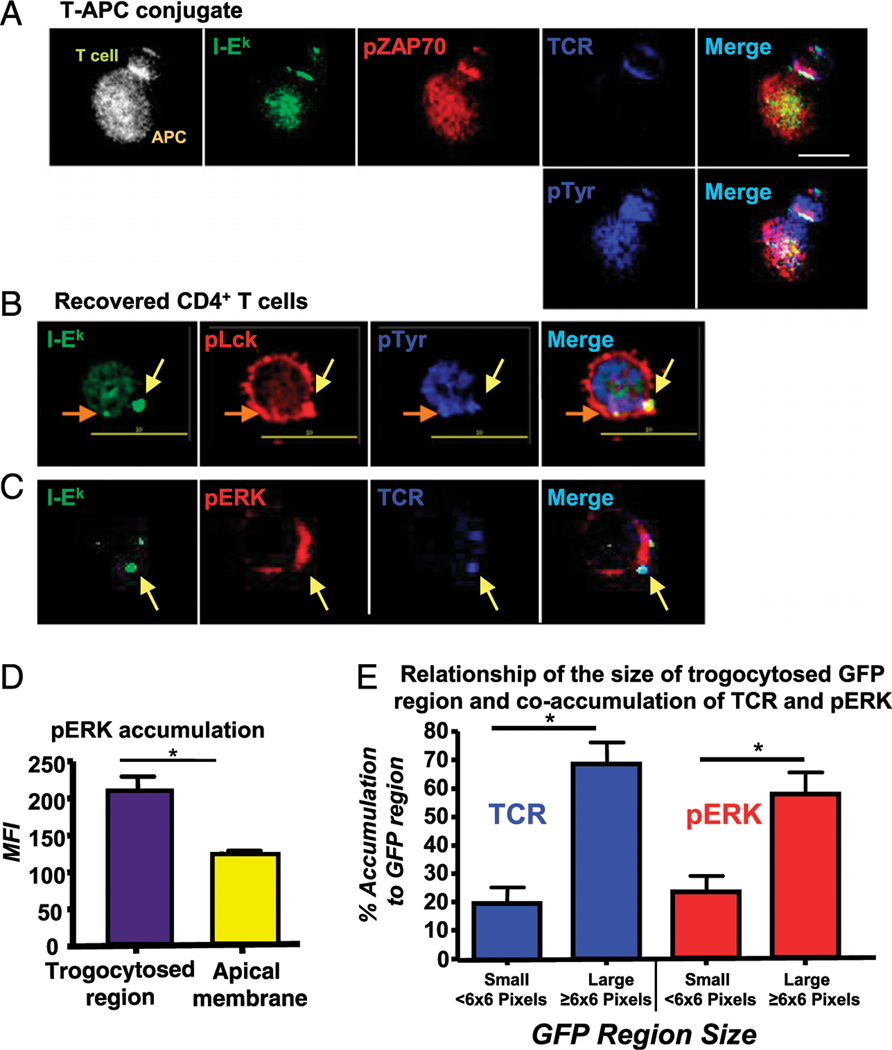
FIGURE 3.
TCR signaling-associated molecules are associated with trogocytosed molecules on the T cell surface. Cells were fixed and stained for the indicated molecules, as described in the Materials and Methods section. (A) Elevated pZAP-70 (red) and pTyr (blue, bottom row) levels colocalize with GFP-tagged MHC:peptide (green) and the TCR (blue, top row) at the immune synapse. These molecules also colocalize with trogocytosed MHC:peptide on the distal pole of the T cell. Fluorescence composite image shows position of T cell and APC. (B) pLck (red) and total pTyr (blue) colocalize with two trogocytosed MHC:peptide molecules (green) regions (indicated by yellow and orange arrows) on T cells recovered from the in vitro trogocytosis assay. Images are from a single focal plane. (C) pERK (red) coassociates with trogocytosed MHC:peptide (green) and TCR (blue) on the recovered trog+ cells. (D) MFI of pERK associated with the trogocytosed MHC:peptide compared with the apical membrane on the same cell. (E) The relationship of the size of the trogocytosed MHC:peptide region on the T cell with the coaccumulation of TCR (blue) and pERK (red). Small regions were defined as <6 × 6 pixels and large ≥6 × 6 pixels. For each condition, ˃100 individual T cell were imaged. Images were collected with a ×60 objective. Scale bars, 10 μm. Bars represent mean ± SEM. Horizontal lines indicate statistical comparison between indicated groups, *p ≤ 0.05.

