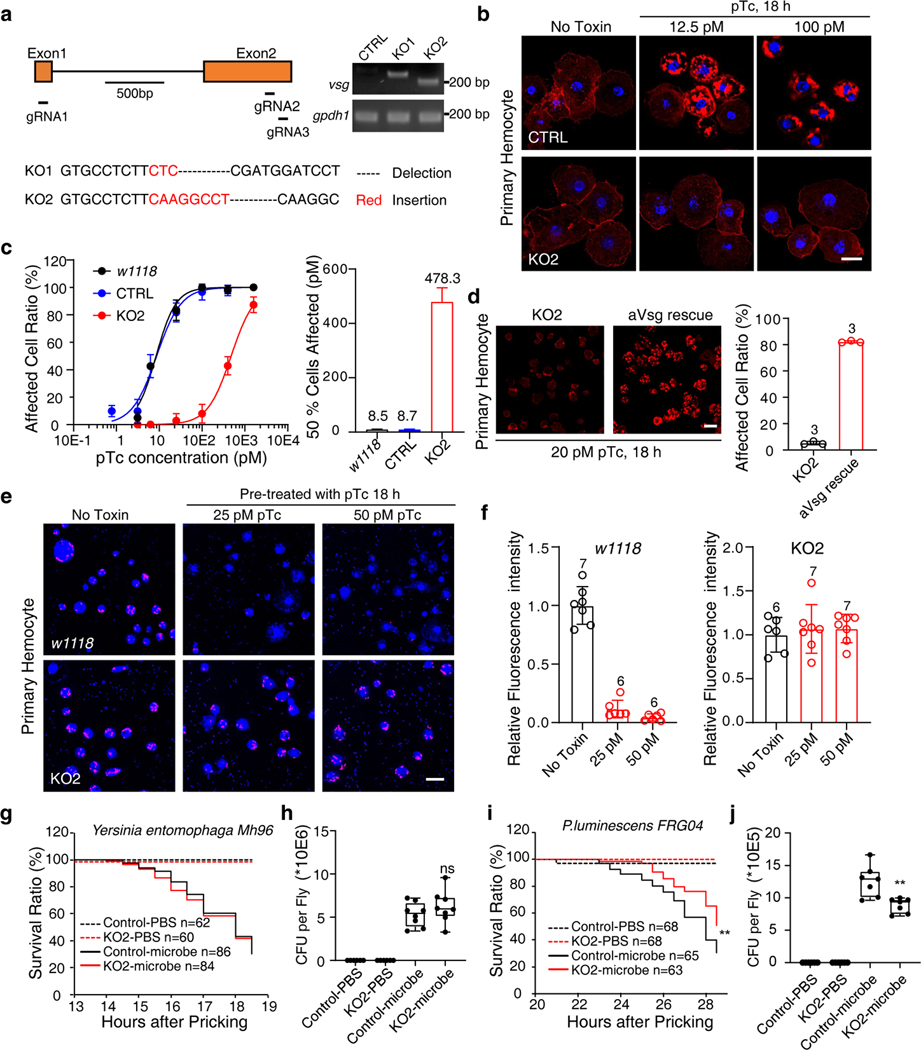
Fig. 4. Vsg KO flies show reduced sensitivity to pTc and P. luminescens infection.
a, Schematic illustration of vsg knock out strategy and the genotyping results of two different vsg KO strains. Representative images were from one of three independent experiments.
b-c, Hemocytes from control (CTRL, nos-Cas9;attP2), vsg KO, or a wild-type strain (w1118) of D. melanogaster were exposed to the indicated concentrations of pTc for 18 h. Cells were fixed and stained with phalloidin (red) and Hoechst dye (blue). Representative images were shown in (b), and percentages of cells with actin clustering were quantified and plotted in (c). Scale bar = 10 μm.
d, Hemocytes from a vsg KO fly line (Hml-Gal4,UAS-EGFP; KO2) and a rescue line that expresses aVsg in hemocytes (Hml-Gal4,UAS-EGFP/UAS-avsg;KO2) were exposed to 20 pM pTc for 18 h. Cells were fixed and stained with phalloidin (red). Scale bar = 20 μm.
e-f, Hemocytes from control (w1118) or vsg KO2 D. melanogaster were treated with pTc (25 pM or 50 pM, 18 h) and then co-incubated with pHrodo™ Red labeled E. coli bioparticles (red) for 30 min. Cells were then washed, stained with Hoechst (blue), and imaged (e). Internalized E. coli fluorescence intensity per cell was counted and plotted (f). Scale bar = 20 μm.
g-h, Control (nos-Cas9;attP2) and vsg KO D. melanogaster were infected with the control bacterium, Yersinia entomophaga, through pricking with an insect pin. Survival curves shown in (g). Flies were collected and homogenized, and bacterial loads (colony formation units) were assessed by serial dilution plating (h).
i-j, Control (nos-Cas9;attP2) and vsg KO D. melanogaster were infected with P. luminescens through pin prick. Survival curves (i) and bacterial loads (j) were shown.
Data in (c), (d) and (f) were analyzed from the total number of images indicated in the Source data or bar graphs from three experiments and shown as mean ± SD or the best-fit value ± 95% CI. Data in (h) and (j) were analyzed from the total number of flies indicated in the Methods section. Center values represent the median. The box plots in (h) and (j) show all points. The bounds are minimum to maximum values, 25th and 75th percentiles, respectively.
Two-tailed test was used for comparing between Control-microbe and vsg KO-microbe group in (h) and (j). Log-rank (Mantel-Cox) test was used for comparing between Control-microbe group and vsg KO-microbe group in (i). p = 0.29 (h), p = 0.008 (i) and p = 0.003 (j). **p < 0.01

