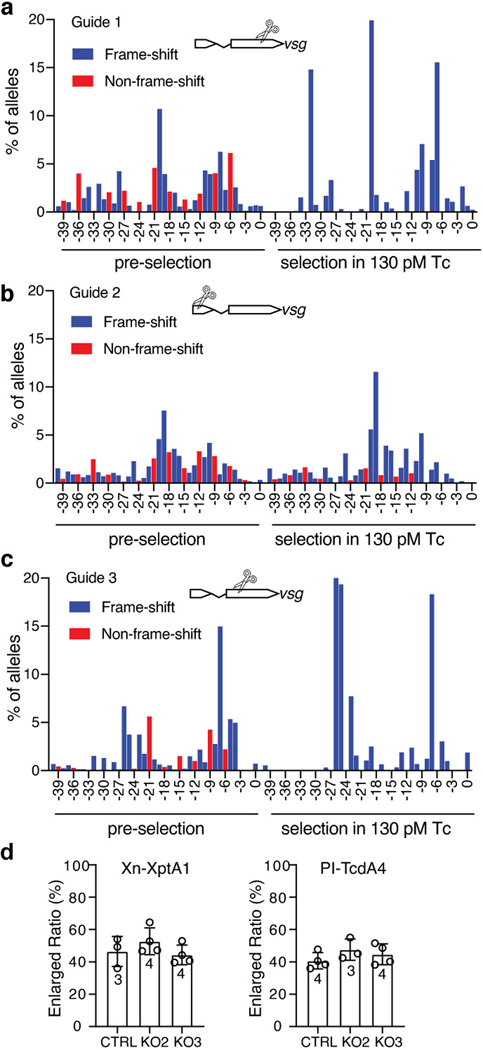
Extended Data Fig. 4. Characterization of Vsg KO S2 cells.
a-c, S2 cells expressing one of the three indicated sgRNAs before or after treatment with 130 pM pTc for 2 weeks were harvested with the sequence at the gRNA targeting sites analyzed by deep sequencing. The frequency of deletions of the indicated size were plotted (insertions represented less than 1% and were ignored). Non-frame-shift mutations (potentially retaining Vsg receptor activity, red) versus frameshift mutations (blue) are shown.
d, Vsg KO2, Vsg KO3, and the control S2 cells expressing scrambled sgRNA were exposed to two Tc toxins (Xn-XptA1, 3.5 nM; PI-TcdA4, 3 nM) for 4 days. Both contain the same TcdB2-TccC3 as pTc but utilize distinct A subunits (XptA1 from X. nematophila and TcdA4 from P. luminescens, respectively). Both toxins induced cell enlargement on Vsg KO cells and showed no difference on potency on control cells versus Vsg KO cells.
Data were analyzed from the total number of images indicated in the bar graphs from three experiments and shown as mean ± SD.

