
Figure 7.
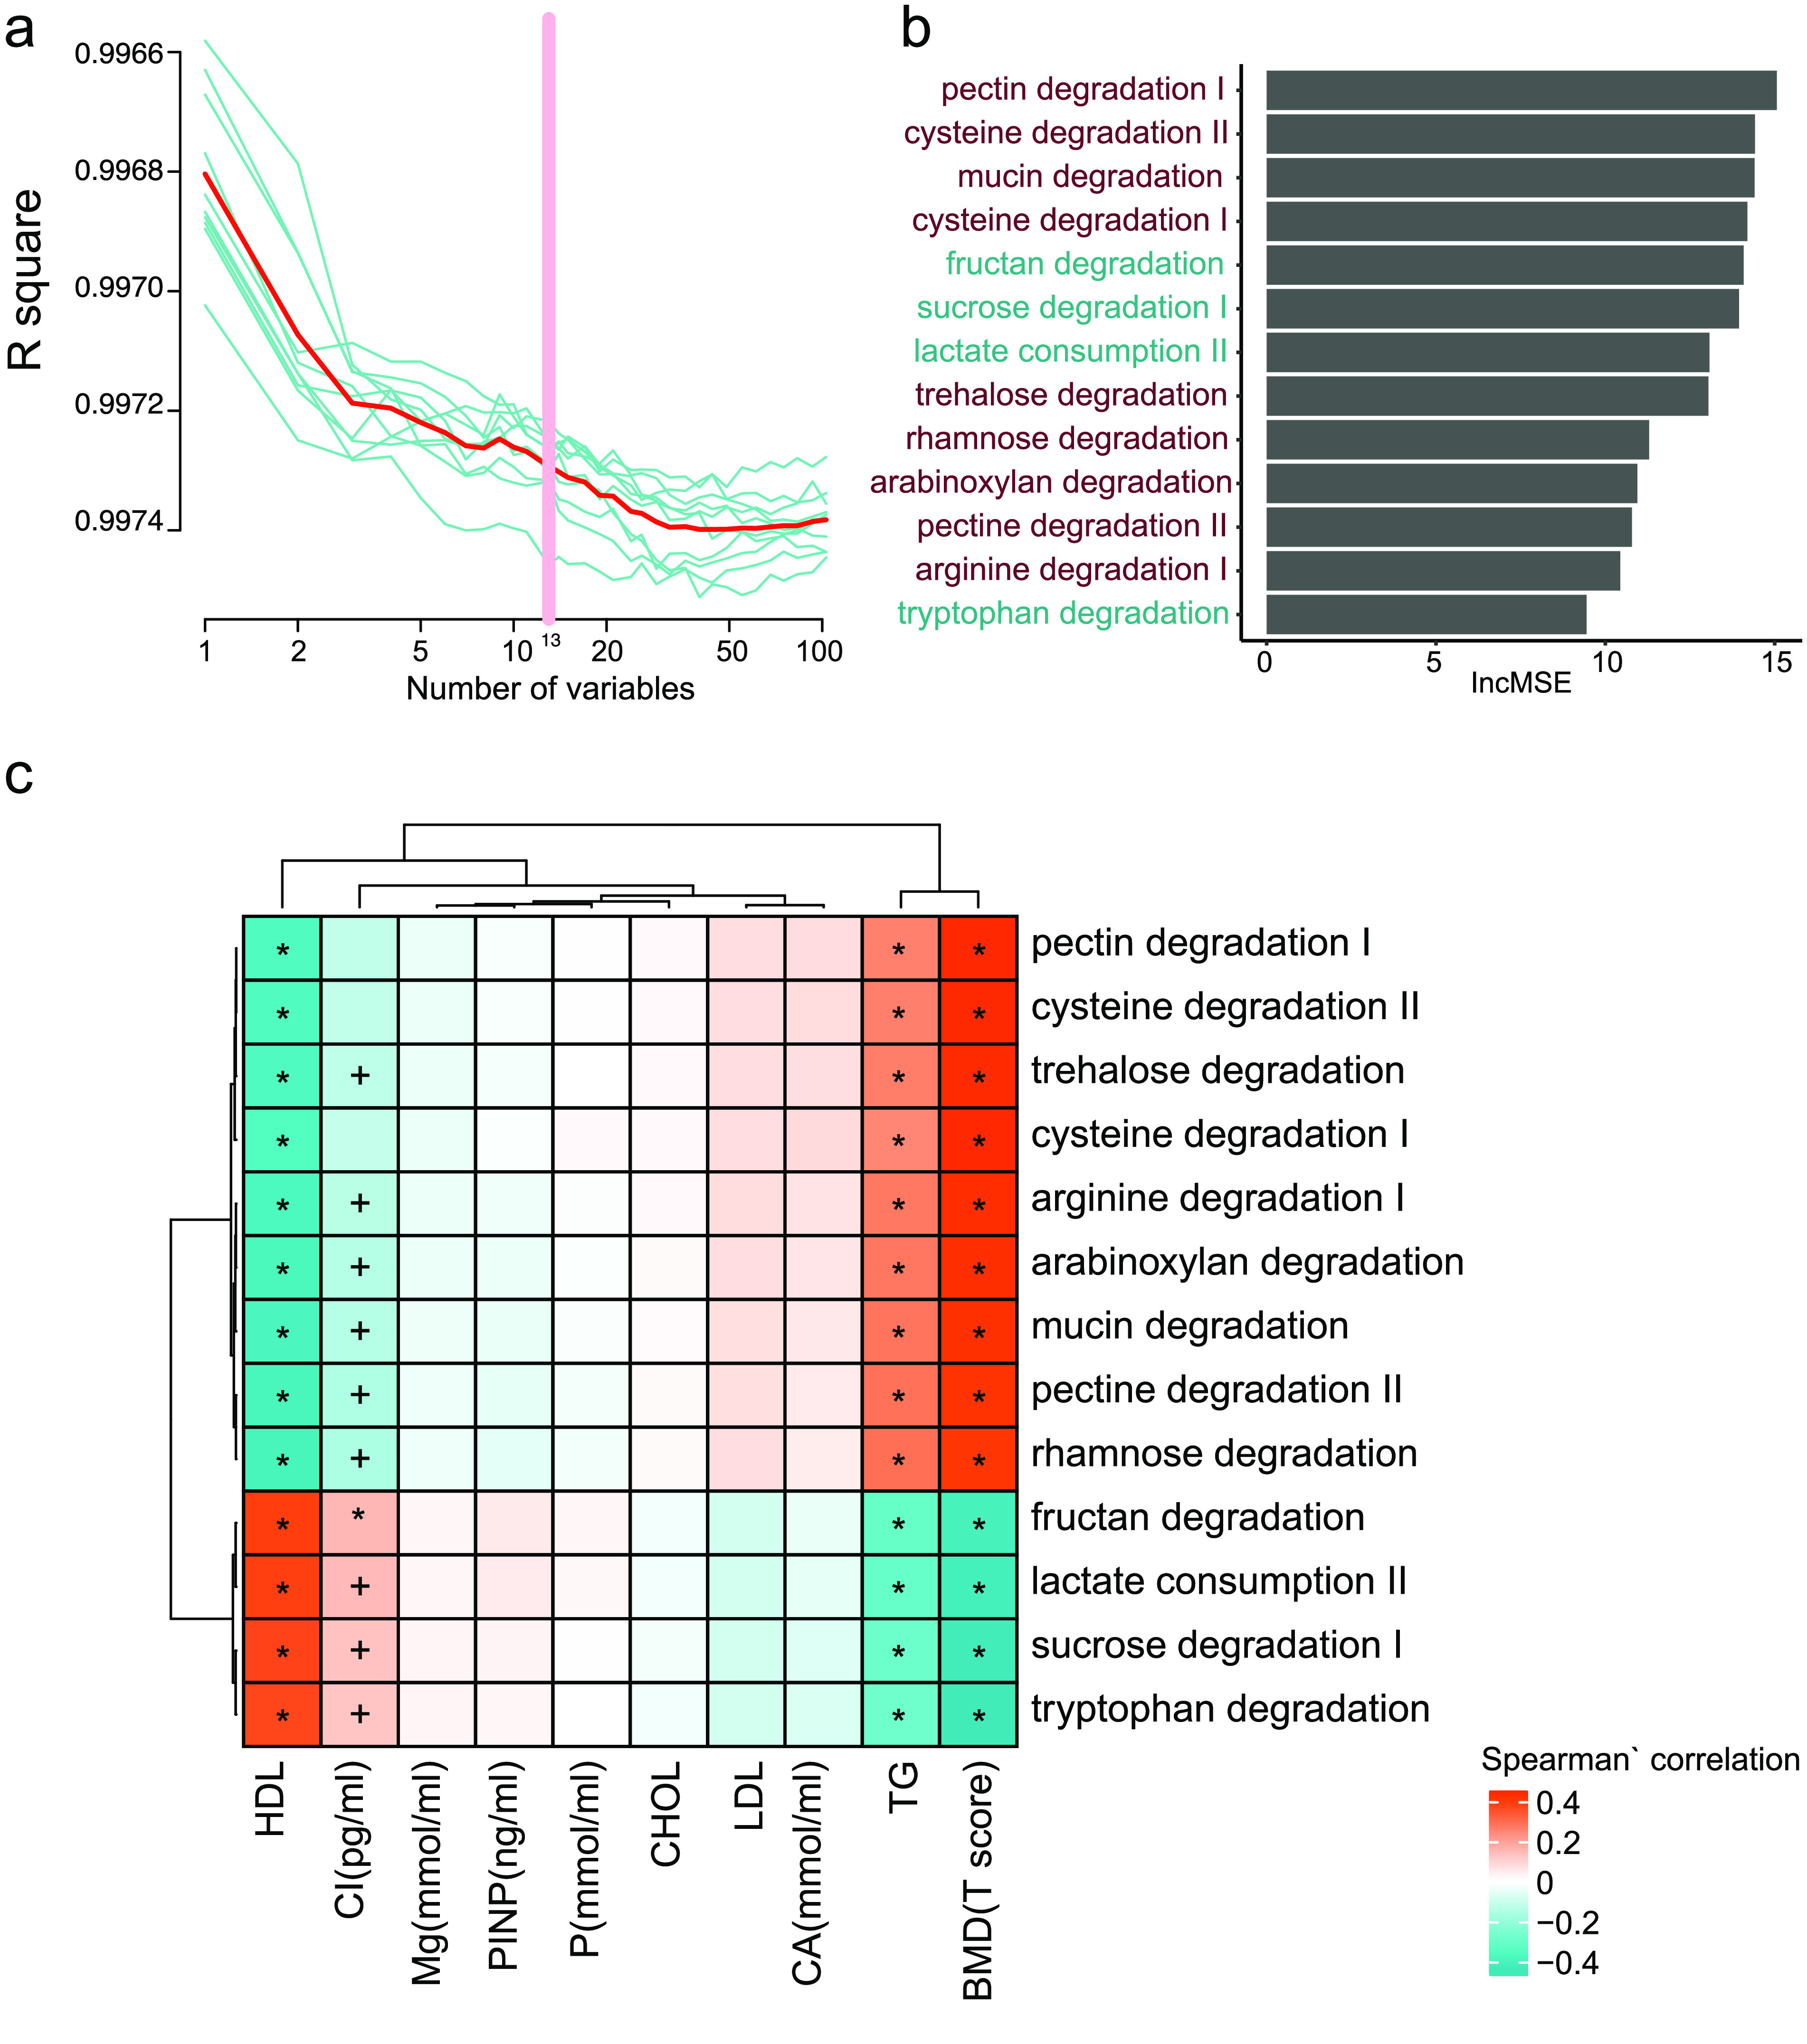
Fecal microbial modules markers for BMD. (a) The R-squared values during the ten-time cross-validation process (the blue lines show the ten different process, the red line shows the average of the ten-time cross validation, and the pink line shows the best variables). (b) The lncMSE of the 13 chosen modules markers. (c) The correlation between the markers and the clinical indeces. (Spearman’ correlation, “+” for p < 0.05; “*” for p < 0.01).