
Figure 2.
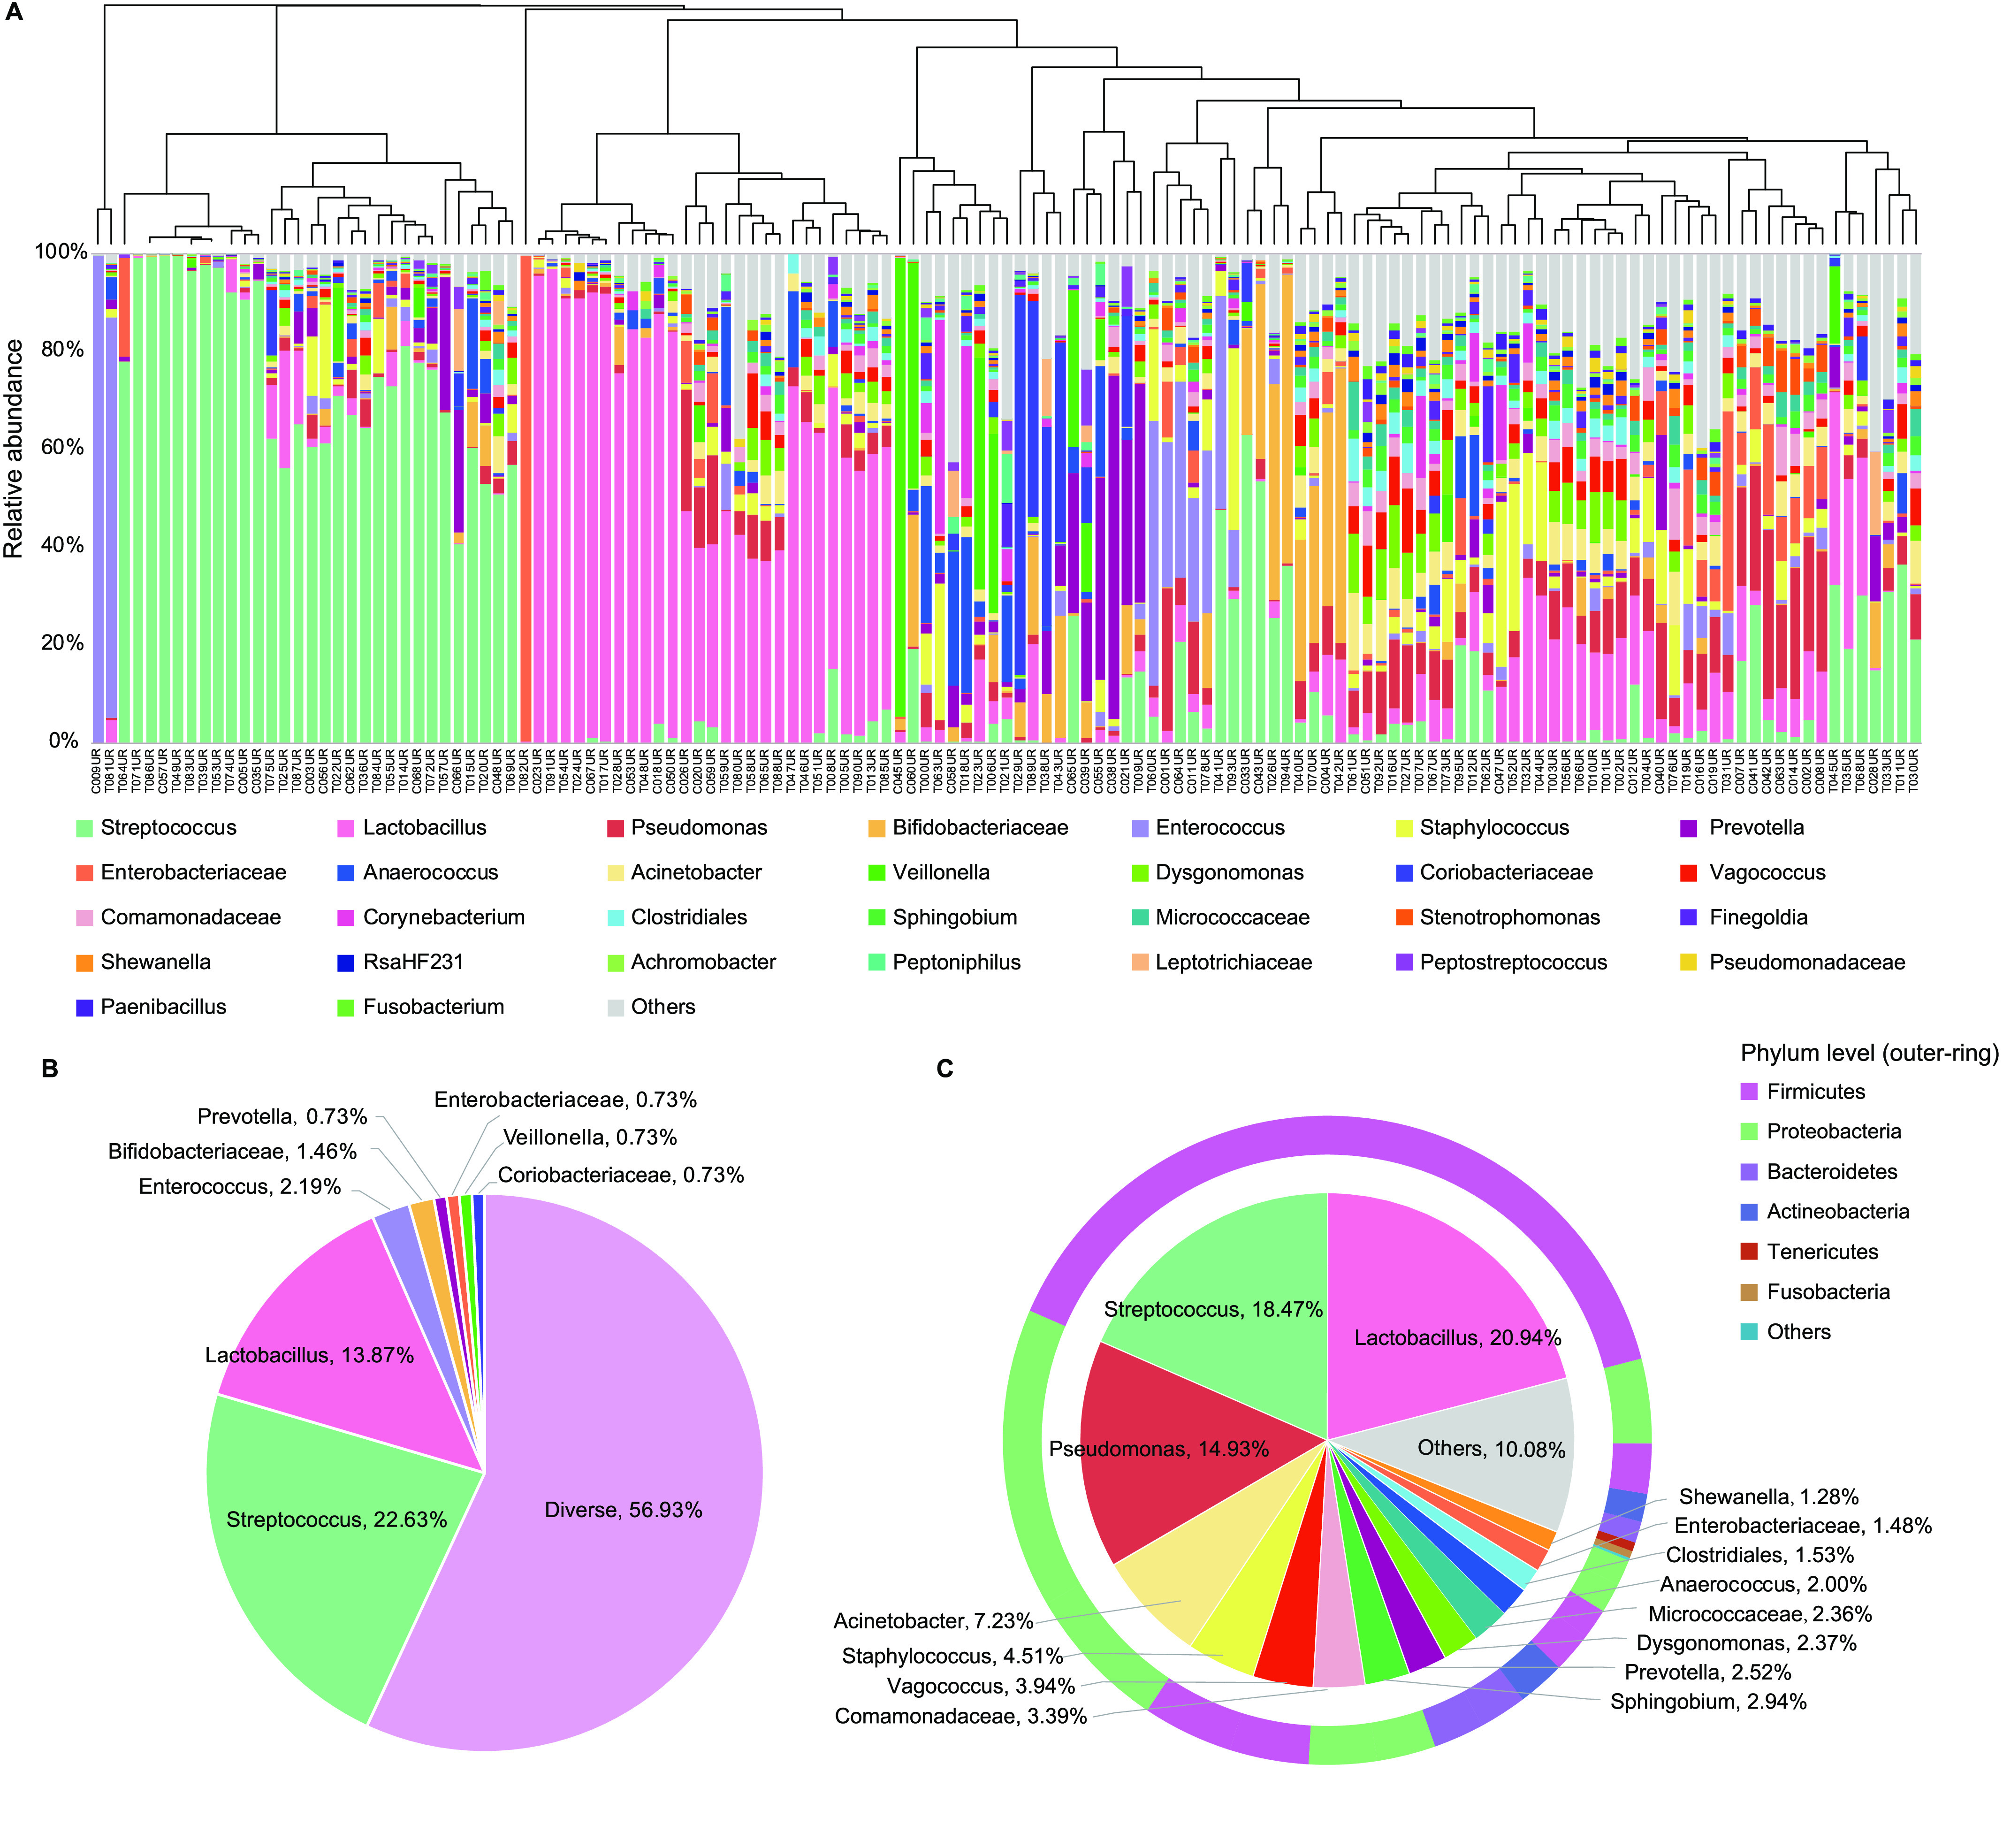
Urinary microbiota of the initial cohort of 137 Chinese reproductive-age women. (A) The relative abundances of genera detected in each individual are shown in the bar chart. The dendrogram is a result of a centroid linkage hierarchical clustering based on Euclidean distances between the microbial composition proportion of urinary bacterial communities. (B) The ratio of different urinary microbiota types. The genus whose relative abundance accounted for >50% in an individual was selected as an identified type. The genera that accounted for <50% of the microbiota in an individual were identified as diverse type. (C) Pie chart for the urinary microbial genera according to their median relative abundance. Genera that took up less than 1% of the microbiota are labelled together as ‘others’. The outer ring indicates the distribution of microbiota at the phylum level.