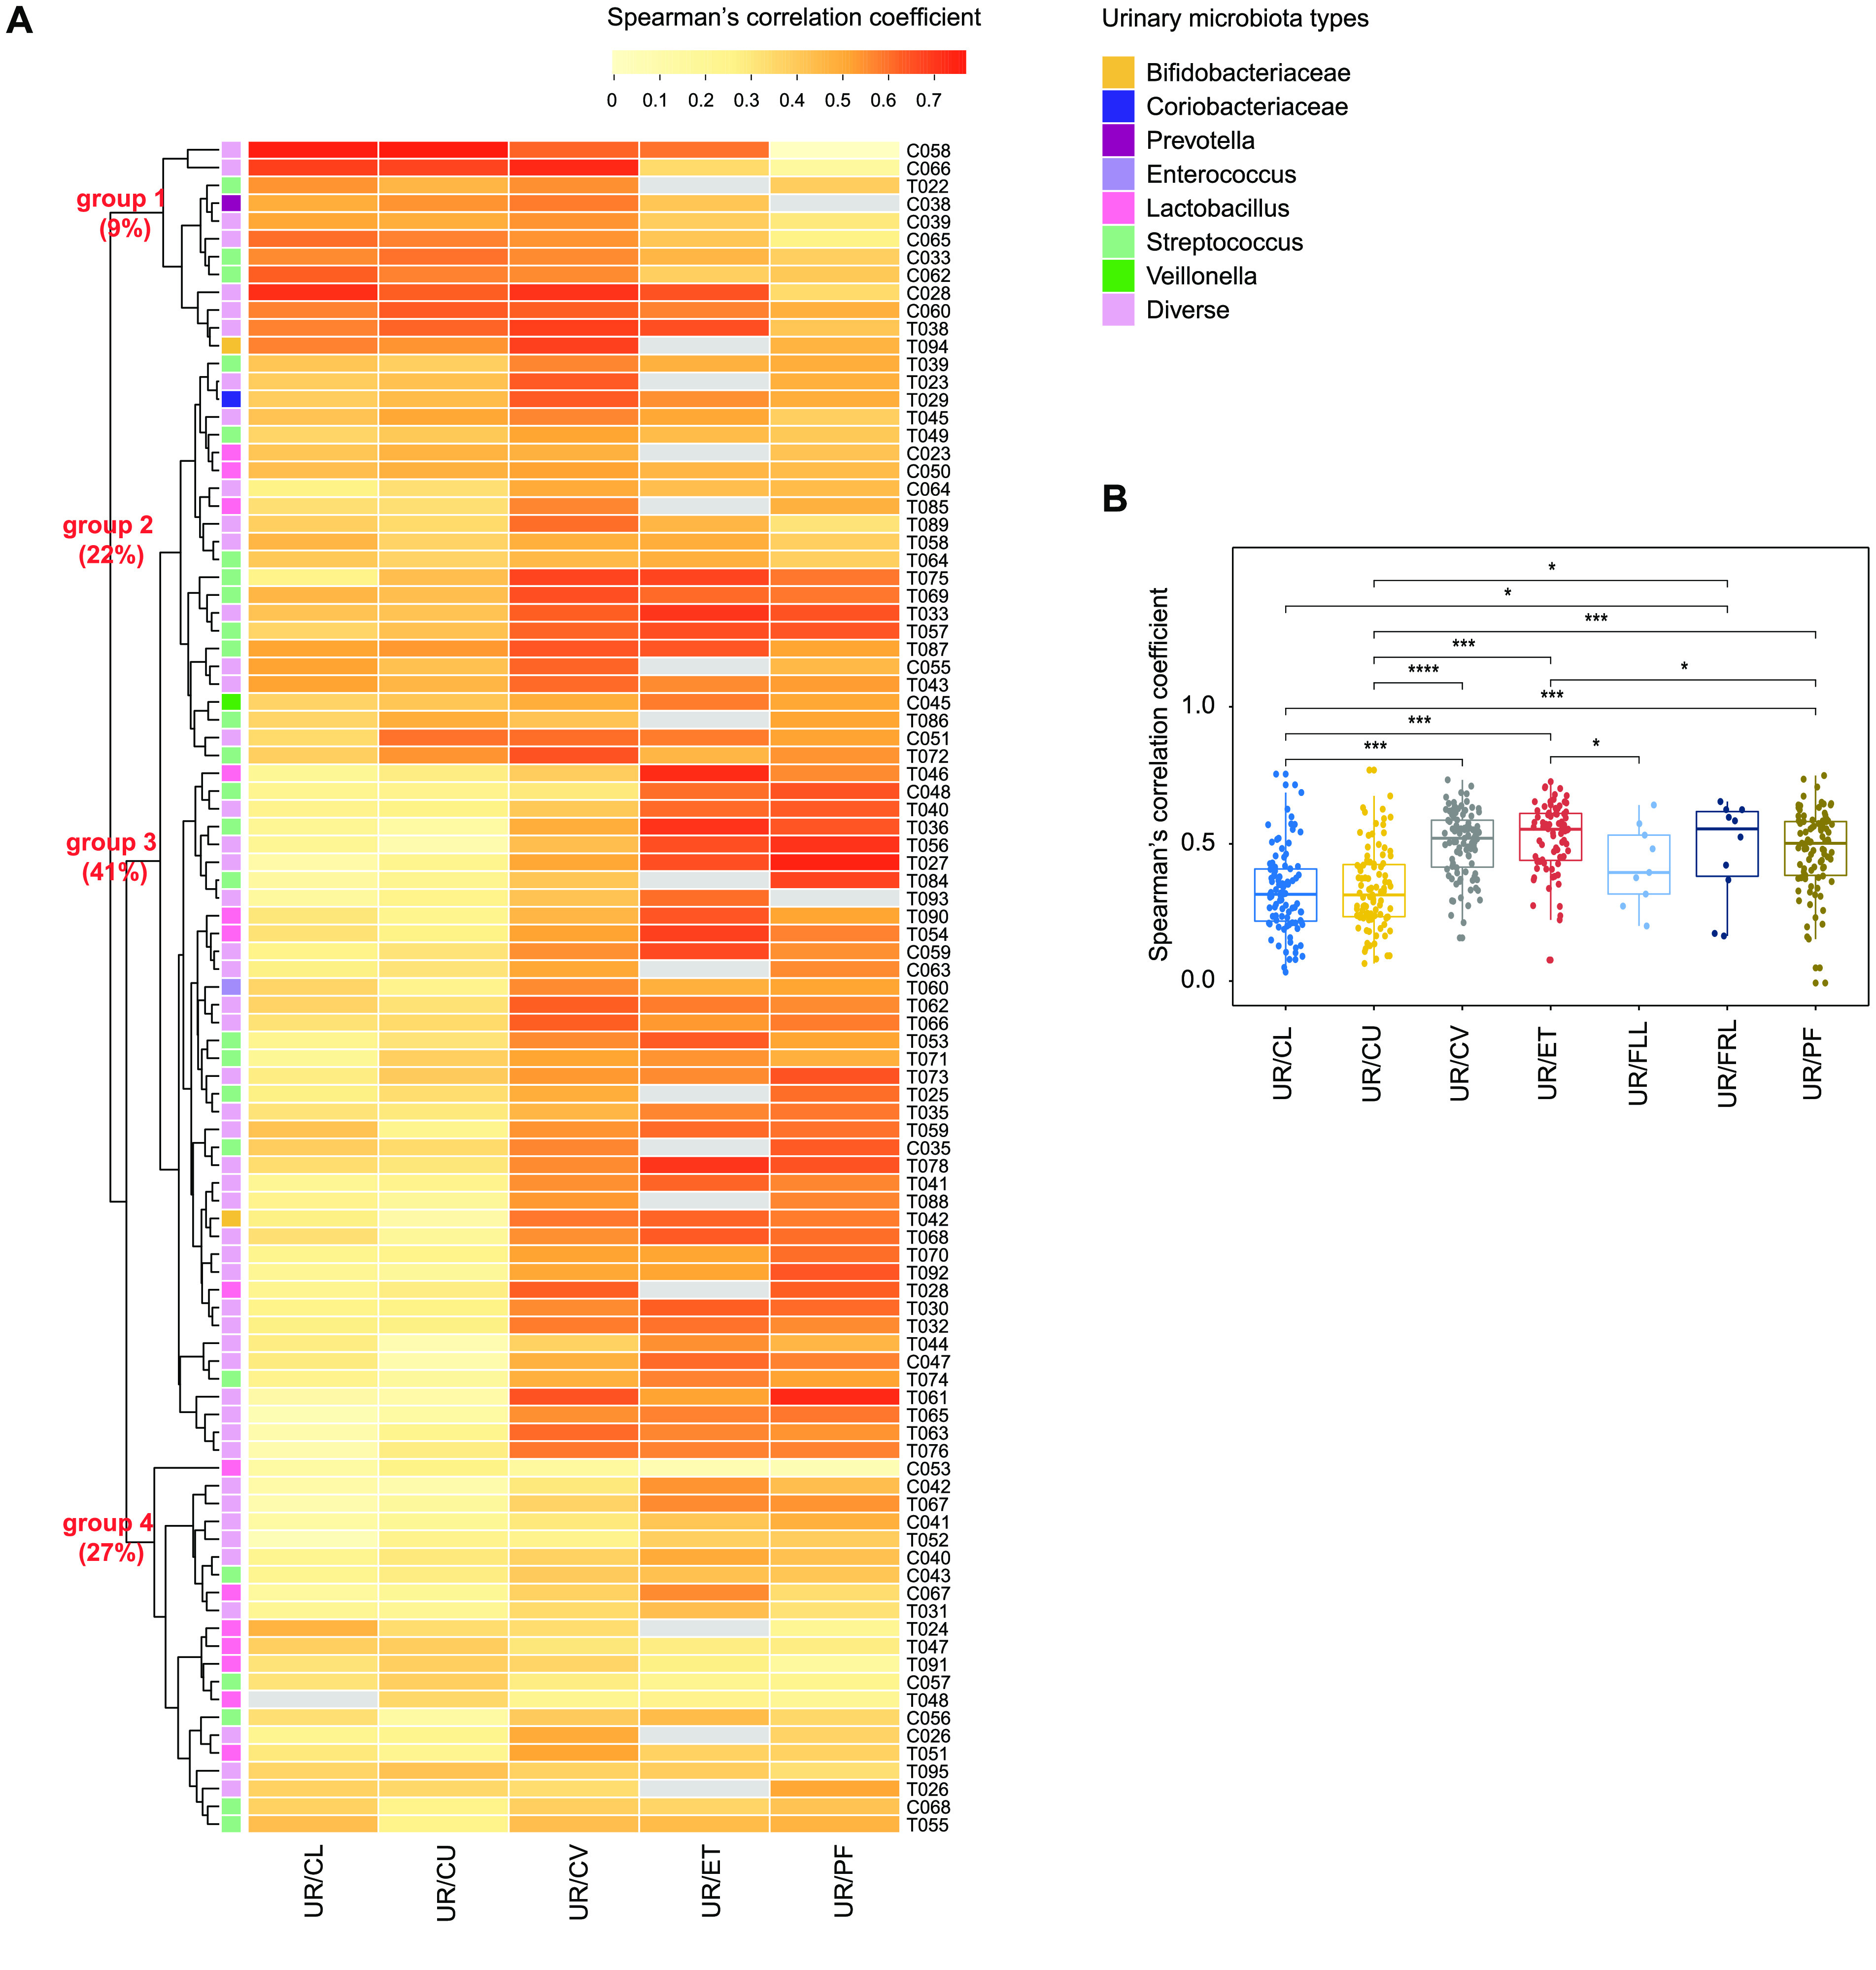
Figure 4.

Similarity of the urine-reproductive tract microbiota within individuals. (A) Heatmap for the intra-individual Spearman’s correlation coefficient between microbiota identified in the urine and at different sites in the reproductive tract (relative_abundance_correlation.csv [8]). Samples derived from the initial cohort of 95 Chinese reproductive-age women, who collected both the urine and reproductive tract samples. As the number of samples from fallopian tubes (FLL, FRL) is too small, the correlation between microbiota in the urine and those in fallopian tubes are not shown. The dendrogram is a result of a centroid linkage hierarchical clustering based on Euclidean distances between the intra-individual Spearman’s correlation coefficient of different body sites. The colored squares illustrate the subtypes found within the urinary microbiome. (B) Spearman’s correlation coefficient between microbiota found in the urine and those from different sites of the reproductive tract. The Wilcoxon ranked sum test was used to calculate the difference. Boxes denote the interquartile range (IQR) between the first and third quartiles (25th and 75th percentiles, respectively), and the line inside the boxes denote the median. The whiskers denote the lowest and highest values within 1.5 times the IQR from the first and third quartiles, respectively. An asterisk denotes p <0.05, two asterisks denote p <0.01, three asterisks denote p <0.001.
