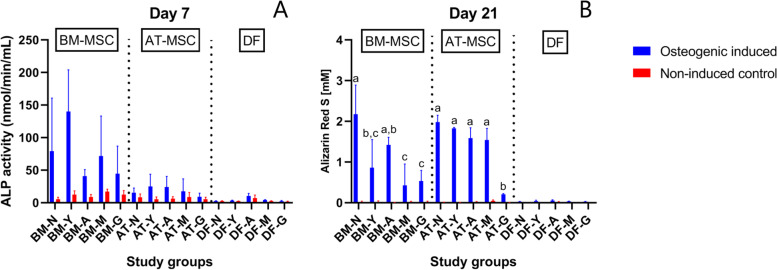
Fig. 4.
Alkaline phosphatase activity and Alizarin Red S concentration of osteogenic induced and control cells. Bar plot showing alkaline phosphatase (ALP) activity (A) and Alizarin Red S concentration (B) as a measurement of calcium deposits of equine bone marrow (BM)- and adipose tissue (AT)-derived mesenchymal stromal cells (MSC) and dermal fibroblasts (DF) (biological negative control) in five different age groups after respectively 7 or 21 days of culture in either osteogenic induction medium or expansion medium (non-induced control) (n = 4 horses per cell type per age group per medium). Age groups within the same osteogenic induced cell type not labeled with the same letter are significantly different from each other with regards to calcium deposition (p < 0.05). Error bars indicate standard deviation. †N: Newborn, Y: Yearling, A: Adult, M: Middle-aged, G: Geriatric

