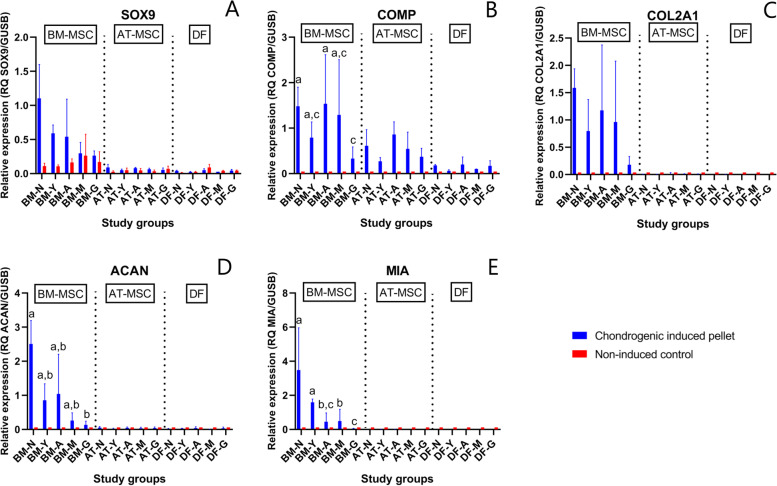
Fig. 5.
Gene expression of selected chondrogenic biomarkers. Bar plots with standard deviation illustrating mean relative gene expression of SRY-box transcription factor 9 (SOX9) (A), cartilage oligomeric matric protein (COMP) (B), collagen type 2 alpha 1 (COL2A1) (C), aggrecan core protein (ACAN) (D), and cartilage-derived retinoic acid-sensitive protein (MIA) (E) in chondrogenic induced pellets and non-induced monolayer controls from bone marrow (BM)- and adipose tissue (AT)-derived mesenchymal stromal cells (MSCs) and dermal fibroblasts (DF) from horses in five different age groups (n = 4 horses per age group per cell type per medium). Age groups within chondrogenic induced BM-MSCs not marked with the same letter are significantly different from each other (p < 0.05). No significant donor age effect was seen for SOX9 or COL2A1. Note different y-axes. †N: Newborn, Y: Yearling, A: Adult, M: Middle-aged, G: Geriatric

