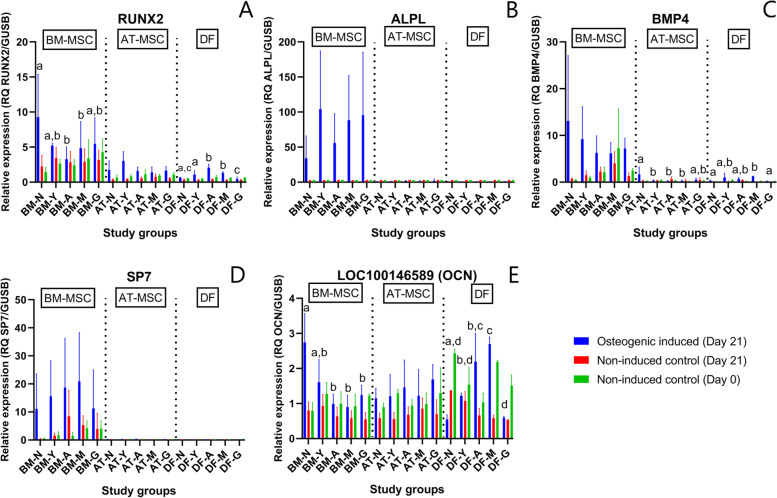
Fig. 6.
Gene expression of selected osteogenic biomarkers. Bar plots with standard deviation illustrating mean relative gene expression levels of runt-related transcription factor 2 (RUNX2) (A), alkaline phosphatase (ALPL) (B), bone morphogenic factor 4 (BMP4) (C), osterix (SP7) (D), and osteocalcin (LOC100146589) (E) in osteogenic induced cells after 21 days of induction and non-induced controls at day 0 and day 21. The cells consist of bone marrow (BM)- and adipose tissue (AT)-derived mesenchymal stromal cells (MSCs) and dermal fibroblasts (DF) from horses in five different age groups (n = 4 horses per age group per cell type per medium). Age groups within the same osteogenic induced cell type not marked with the same letter are significantly different from each other (p < 0.05). Note different y-axes. †N: Newborn, Y: Yearling, A: Adult, M: Middle-aged, G: Geriatric

