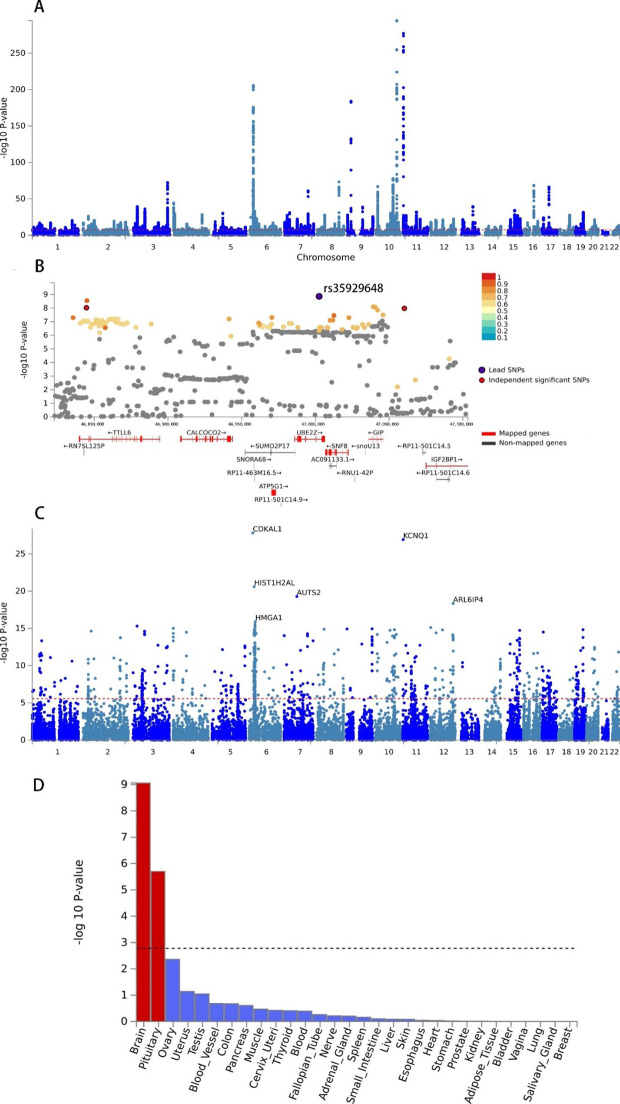
Fig. 3.
Genome-wide cross-trait/ethnic meta-analysis results of SCZ and T2DM through using CPASSOC methods. A. A representative Manhattan plot of meta-analysis result of combined EAS and EUR population. The x-axis is the chromosomal position of SNPs and the y-axis is the significance of the SNPs (-log10P). B: One representative genomic risk locus containing a novel top independent cross-trait significant SNP (indSigSNPs), i.e. rs35929648. IndSigSNPs are SNPs independent of each other (r2 < 0.6) with P ≤ 5.0 × 10 − 8, top IndSigSNPs are IndSigSNPs with the minimum P value within a 250 kb window. Genomic risk loci were identified by merging IndSigSNPs if they were closer than 500 kb apart. In this genomic risk loci, there are three independent significant SNPs. Each SNP is color-coded based on the highest r2 to one of the independent significant SNPs (indSigSNPs) if that is greater or equal to the r2 threshold of 0.6. Other SNPs (below the r2 of 0.6) are colored in grey. Gene property analysis results. C. Positional genes mapping results with the top 6 genes labelled. D. Tissue specificity of indsigSNPs in GTEx V8 30 tissue types using the MAGMA tool

