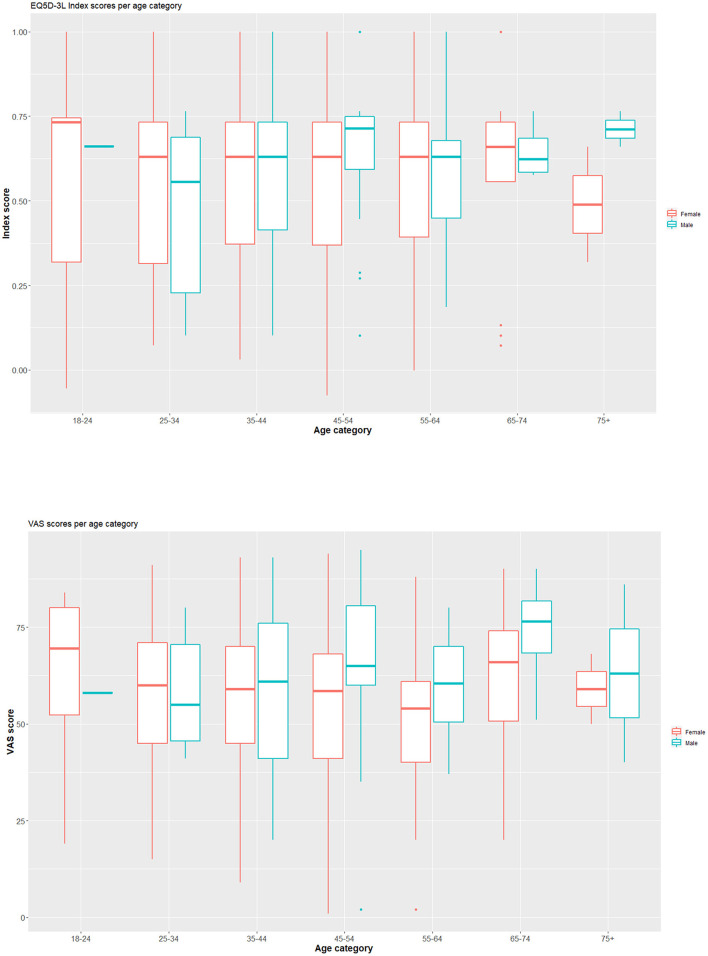
Figure 1.
Boxplots presenting the index score and VAS score for COVID-19 infected persons, separated by sex and age category. Index scores are presented in the upper row, VAS scores in the lower row. On the plot, median values are represented by the horizontal line within the box; the latter indicating the first and third quartiles.

