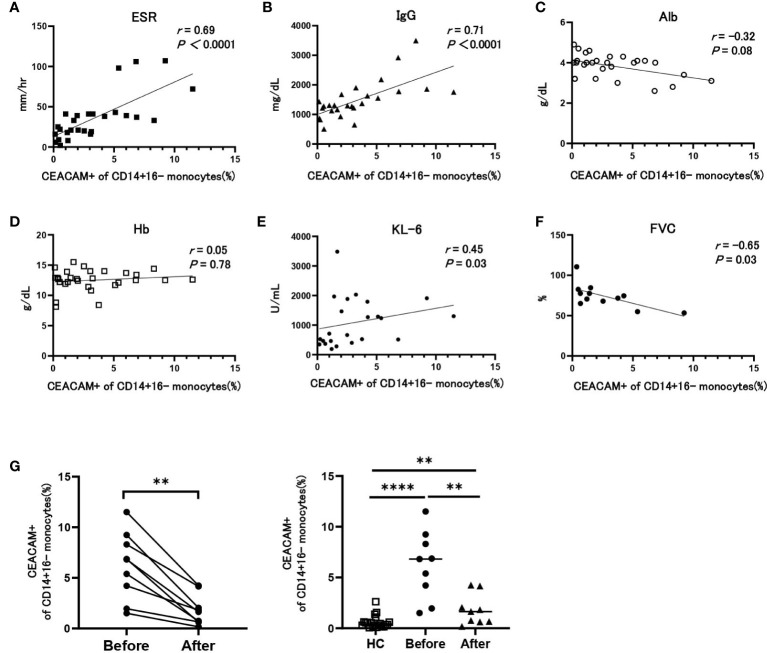
Figure 2.
The association between the proportion of CEACAM-positive cells in classical monocytes and clinical parameters in patients with SSc. (A-F) Correlation between the proportion of CEACAM+ cells in CD14+16- monocytes and ESR (A), serum IgG (B), serum albumin (C), hemoglobin (D), serum KL-6 (E), and forced vital capacity (FVC) (F) in patients with SSc. Correlation coefficients and P values were calculated using Spearman’s rank correlation test. (G) The proportion of CEACAM+ cells in CD14+16- monocytes before and after immunosuppressive therapies in patients with SSc (n=8) and HCs. P values were calculated using a Wilcoxon matched pairs signed rank test. The right figure shows comparisons of the proportion of CEACAM-positive monocytes between HCs and SSc patients before and after therapy with immunosuppressant. P values were calculated using a Mann–Whitney U test. **P < 0.01, ****P < 0.0001.

