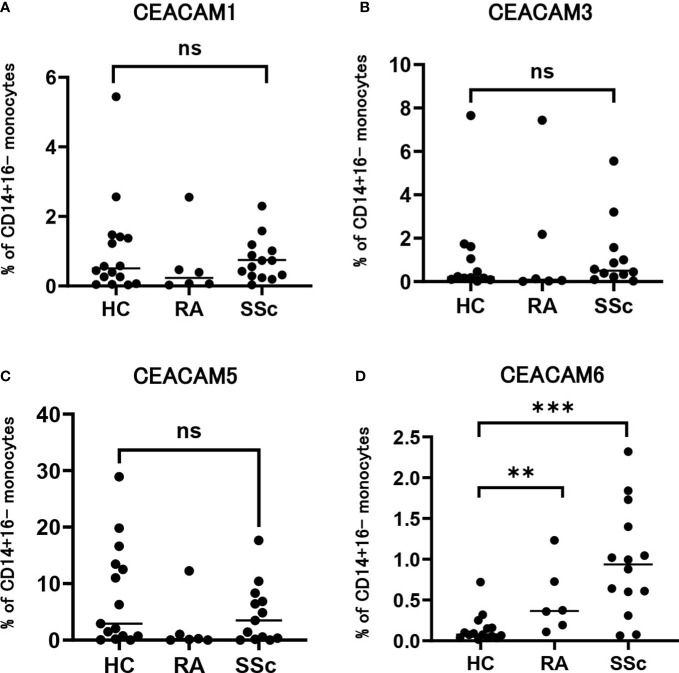
Figure 3.
Expression of each subtype of CEACAM on SSc monocytes. (A-D) Dot plots show the proportion of positivity of CEACAM1 (A), CEACAM3 (B), CEACAM5 (C), and CEACAM6 (D) on CD14+CD16- classical monocytes from HCs and patients with RA and SSc. P values were calculated using a Mann–Whitney U test. **P < 0.01, ***P < 0.001. ns, not significant.

