Figure 4.
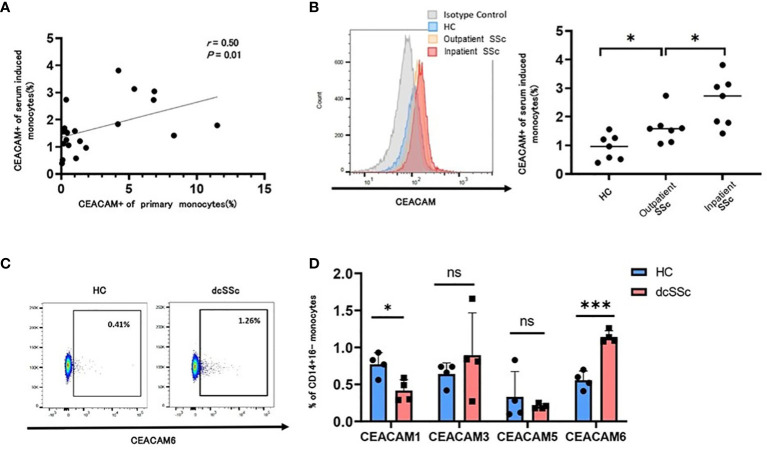
SSc serum induced CEACAM6 expression on classical monocytes. CD14+16- monocytes were isolated from a healthy donor and were treated with serum from HCs (n=7) and patients with systemic sclerosis (n=14) for 15 h. The proportion of CEACAM-positive classical monocytes from patients with SSc who provided serum was also analyzed. (A) Dot plots show the correlation between the proportion of CEACAM+ monocytes from a healthy donor treated with SSc serum and that from patients with SSc obtained at the same time as the serum. Statistical analysis was performed using Spearman’s rank correlation test. (B) The frequency of serum-induced CEACAM+CD14+16- monocytes was compared among HCs (n=7), inactive SSc (n=7), and active SSc (n=7). Each analysis was performed in duplicates. The left figure shows a histogram of CEACAM. (C, D) Data show the frequency of CEACAM1, 3, 5, and 6+ monocytes treated with serum from HCs or patients with dcSSc. Gating of CEACAM6+ monocytes is shown in (C) Data are presented as mean ± standard deviation (SD). P values were calculated using an unpaired t-test. *P < 0.05, ***P < 0.001.

