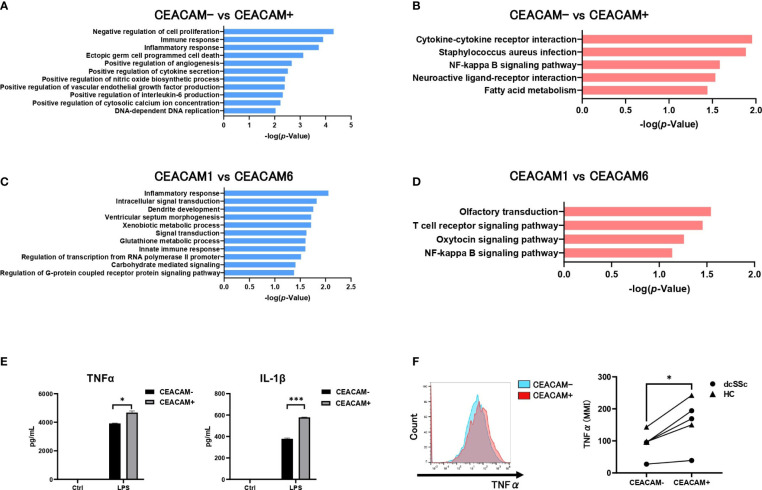
Figure 5.
CEACAM-positive monocytes present with an inflammatory phenotype. The GO functional category analysis (A) and the KEGG pathway functional classification (B) of genes differentially expressed in CEACAM+CD14+16- monocytes and CEACAM-CD14+16- monocytes from a patient with dcSSc. DAVID v6.7 functional annotation bioinformatics microarray analysis software was used to obtain the GO biological process functional category and the KEGG pathway functional classification. Only GO and KEGG pathway terms for categories that showed statistically significant differences are shown (P-value ≤ 0.01 in A or P-value ≤ 0.05 in B). GO functional category analysis (C) and KEGG pathway functional classification (D) of genes differentially expressed in CEACAM6+CD14+16- monocytes and CEACAM1+CD14+16- monocytes. Only GO and KEGG pathway terms with P-value ≤ 0.05(C) or P-value ≤ 0.1(D) are shown. (E) ELISA assay for the secretion of TNF-α and IL-1β by CEACAM+CD14+16- and CEACAM-CD14+16- monocytes treated with LPS (50 ng/mL) for 6h. Data are expressed as the mean ± SD, and P values were calculated using an unpaired t-test. (F) The intracellular expression of TNF-α was analyzed using CyTOF (n=5). Representative histogram (left) and the Mean Metal Intensity (MMI) (right) are shown. P-values were calculated using paired t-tests. *P < 0.05, ***P < 0.001.

