Figure 3.
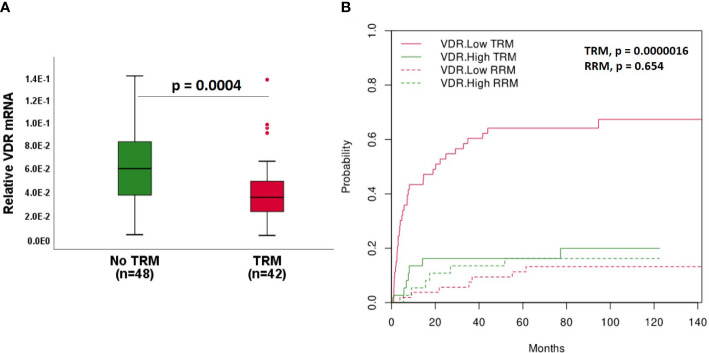
VDR expression with respect to TRM. (A) VDR gene expression in patients without and with TRM. Median survival time in: No TRM = 88 months, TRM = 11 months. (B) Association of VDR with cumulative incidence function estimates for competing risk data. Patients were classified according to high (green line) and low (red line) expression of VDR based on ROC curve. The cumulative risk of TRM and RRM with respect to months after biopsy retrieval is shown. Box plots represent the median, upper and lower quartile and whiskers indicate minimal and maximal values. p value, Mann-Whitney U test.

