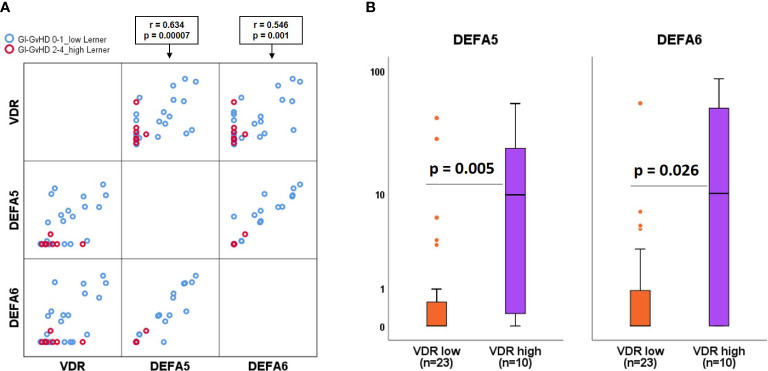
Figure 4.
Association of anti-microbial peptides with VDR. (A) Matrix scatter correlation plot of VDR, DEFA5, DEFA6 genes within low (blue circles) and high (red circles) Lerner GvHD. (B) Comparison of alpha defensins gene expression in patients with low versus high VDR gene expression. Box plots represent median, upper and lower quartile and whiskers indicate minimal and maximal values. r value, Spearmann correlation coefficient. p value, Mann-Whitney U test.

