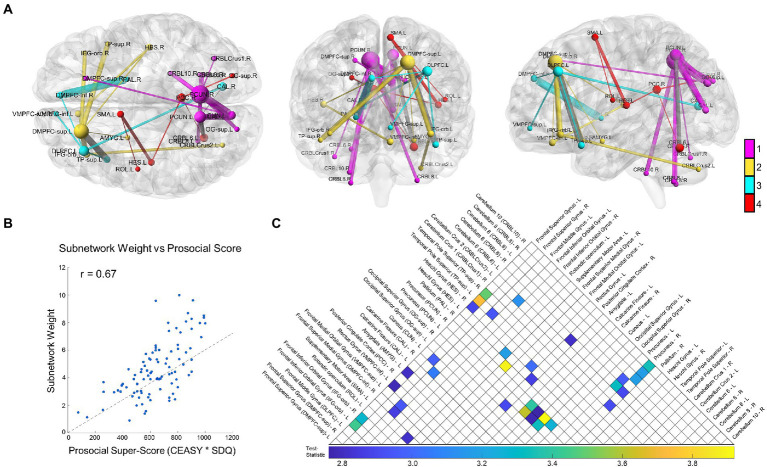
Figure 1.
Study results. We show the overall results from the Network-Based Statistic (NBS) with resting state functional connectivity related to prosociality and compassion. (A) The NBS identified subnetwork is depicted from three orthogonal directions, from left to right: axial, coronal, and sagittal. For visualization, node size scales relative to that node’s degree (number of connections) and edge thickness scales relative to that edge’s test-statistic (relationship strength to prosociality and compassion). Network modules were identified using the Louvain community detection algorithm, and the nodes and edges are colored relative to their module (inter-modular edges shown in gray). In summary, the module shown in magenta centers on the bilateral precuneus and connects with the right DMPFC-inf, bilateral occipital lobe and cerebellum; the yellow module centers on the left DMPFC-sup and connects to regions including the bilateral IFG, left amygdala, and bilateral TP-sup, right Heschl’s gyrus, and left VMPFC; the cyan module centers on the left DLPFC and connects to regions including the right DMPFC-inf, left TP-sup, right calcarine fissure, and right pallidum; finally the red module is more central, connecting the PCC, to the occipital lobe, left Heschl’s gyrus, the Rolandic operculum, and the SMA. (B) A scatter plot showing the relationship between the total subnetwork weight (sum of all functional connectivity edge weights in the subnetwork) and the prosocial and compassion questionnaire scores. The dotted line shows the least-squares regression fit. The Pearson’s correlation is highly significant (r = 0.67, p < 0.0001). (C) An upper-triangle of the adjacency matrix depicting the same network shown in (A), with a list of all subnetwork regions defined by the AAL atlas along their respective row/column indices. The matrix entries visualize the edge test-statistic with colored values based on the underlying color bar. Brain networks in this figure were visualized with BrainNet Viewer (Xia et al., 2013).

